

Fleet productivity measurement explained for UK operators

Fleet productivity measurement is the systematic tracking of key performance indicators (KPIs) to quantify how effectively your vehicles, drivers, and assets deliver operational output. For UK fleet managers, this goes well beyond counting miles driven or fuel consumed. Fleets tracking 15 or more KPIs in real time achieve 24% lower cost per mile and 31% higher vehicle uptime compared to those relying on monthly spreadsheet reports. That gap represents real money and real competitive advantage. Tools like telematics platforms, KPI dashboards, and integrated data analytics are the foundation of fleet productivity measurement explained in practice. Get the measurement right, and every operational decision you make becomes faster, cheaper, and better evidenced.
What are the key metrics and KPIs for measuring fleet productivity?
Fleet performance metrics fall into four categories: operational, financial, maintenance, and safety. Each category answers a different question about how your fleet is performing, and together they give you a complete picture.
Operational KPIs
Vehicle uptime percentage is the most watched operational metric. The industry target is 95% or above, and the business case is stark. Every 1% uptime improvement on a 100-vehicle fleet can increase annual revenue capacity by £140,000–£270,000. That figure makes uptime a board-level concern, not just a workshop one. Asset utilisation rate sits alongside uptime as a core operational measure. It tells you what proportion of your fleet is actively working versus sitting idle.
Financial KPIs
Cost per mile (or cost per kilometre) is the single most useful financial KPI for day-to-day management. It captures fuel, maintenance, tyres, and driver costs in one comparable figure. Total cost of ownership (TCO) combines purchase price, depreciation, maintenance, fuel, and downtime costs into a single figure that guides buy-versus-replace decisions. When TCO rises sharply on an ageing vehicle, the data makes the replacement case for you.
Maintenance KPIs
Mean Time Between Failures (MTBF) measures how long a vehicle operates between breakdowns. A rising MTBF signals that your preventive maintenance programme is working. Mean Time To Repair (MTTR) measures how quickly your team resolves faults once they occur. Both figures directly affect vehicle availability and, by extension, your ability to fulfil contracts on time.
Safety KPIs
Driver behaviour scores, incident rates, and speeding events per 1,000 miles are the primary safety metrics. Poor safety KPIs correlate with higher insurance premiums, increased vehicle wear, and greater DVSA scrutiny. Tracking them consistently is not optional for any UK operator holding an Operator Licence.
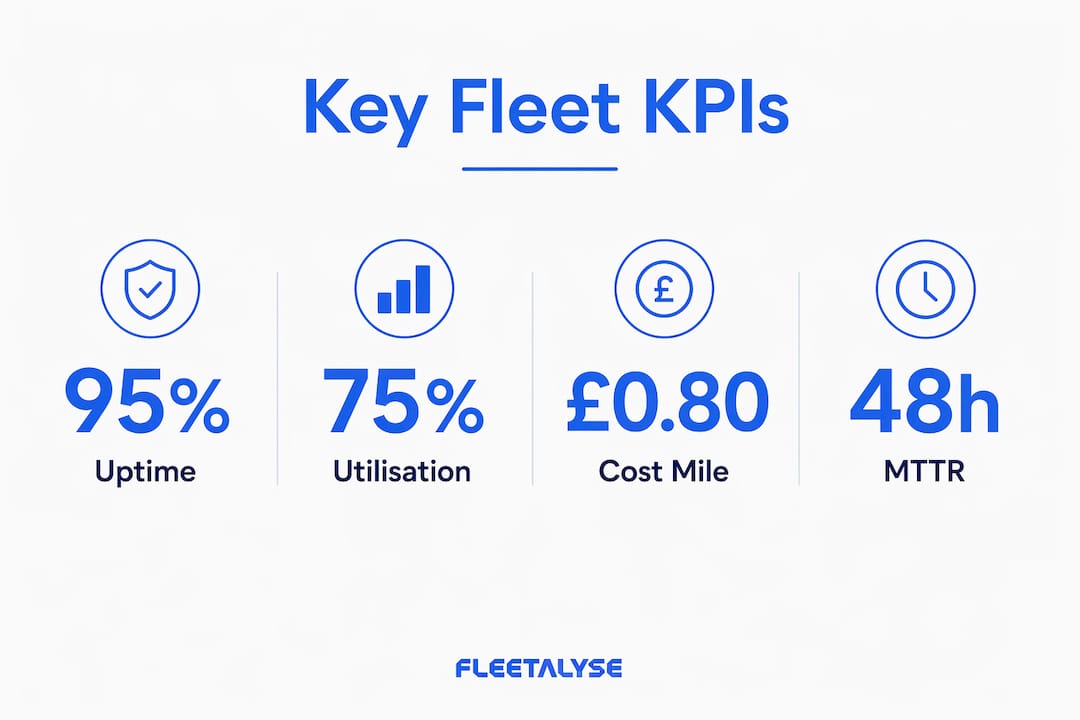
The table below summarises the most critical KPIs with their formulas, targets, and business impact.
| KPI | Formula | Target benchmark | Business impact |
|---|---|---|---|
| Vehicle uptime % | (Available hours ÷ Total hours) × 100 | 95%+ | Direct revenue capacity |
| Asset utilisation rate | (Active hours ÷ Available hours) × 100 | 75%–80% | Identifies idle assets |
| Cost per mile | Total operating costs ÷ Total miles | Varies by fleet type | Controls operating budget |
| MTBF | Total operating time ÷ Number of failures | Maximise | Measures maintenance quality |
| MTTR | Total repair time ÷ Number of repairs | Minimise | Measures workshop responsiveness |
| TCO | All ownership + operating costs combined | Benchmark by asset age | Informs replacement decisions |
Pro Tip: Do not build a dashboard with every metric you can collect. A focused scorecard built around utilisation, downtime, and cost per mile gives you the best operational insight for weekly decisions.
How does data accuracy affect fleet productivity measurement?
Accurate data is the foundation of trustworthy KPIs. The problem is that fleet data is rarely as complete as it looks on a dashboard.
Between 50% and 90% of operational events may sit outside your formal systems entirely. Driver radio calls, WhatsApp messages to the transport office, and verbal yard instructions all represent real operational activity that never enters your telematics or CMMS (Computerised Maintenance Management System). The result is a dashboard that reflects paperwork rather than what actually happened in the yard.
MTTR is a particularly common victim of this problem. Repair time measurement typically begins when a formal work order opens, not when the driver first reported the fault. That gap can be 30 minutes to several hours. Your MTTR figures look better than they are, and you make decisions based on a false picture of workshop responsiveness.
The practical consequences of fragmented data include:
- Underestimated downtime, which inflates your apparent uptime percentage
- Missed maintenance triggers because informal fault reports never reach the system
- Inaccurate driver hours records when tachograph data is not cross-referenced with GPS position
- Skewed cost-per-mile figures when fuel card data and telematics mileage are not reconciled
Pro Tip: Audit your data sources before you build or redesign a dashboard. Map every place where operational information is generated, including informal channels, and decide how each source will feed into your KPIs. The goal is to measure what actually happens, not just what gets logged.
What tools are most effective for real-time fleet measurement?
The right technology closes the gap between what happens in the yard and what appears on your screen. Modern fleet productivity tools fall into several categories, and the most effective setups integrate them rather than running them in isolation.
Effective KPI dashboards integrate telematics, CMMS work orders, fuel cards, and driver logs into unified real-time visualisations. This consolidation means a fleet manager can see vehicle location, maintenance status, fuel consumption, and driver behaviour in a single view rather than switching between four separate systems. The speed of decision-making improves significantly when data is consolidated.
The table below compares manual reporting with automated dashboard approaches.
| Approach | Data freshness | Time to insight | Accuracy risk | Best suited for |
|---|---|---|---|---|
| Monthly spreadsheet reports | 30 days old | Hours of manual work | High (human error) | Very small fleets |
| Weekly automated reports | 7 days old | Minutes | Medium | Small to medium fleets |
| Real-time KPI dashboard | Live or near-live | Immediate | Low (system-driven) | Medium to large fleets |
GPS telematics units are the primary data source for operational KPIs. They capture location, speed, idling time, mileage, and, on HGVs, CAN-bus data including engine diagnostics. Tachograph integration adds driver hours compliance data to the same feed, which is a legal requirement for most UK commercial operators. Fleetalyse’s GPS tracking and telematics solutions are built specifically for UK compliance requirements, covering HGVs, vans, trailers, and mixed fleets with plug-and-play hardware that does not require a professional installer.
Smart dashcams add a further layer by capturing driver behaviour events such as harsh braking, lane departure, and distraction. When dashcam footage is linked to telematics data, safety KPIs become verifiable rather than estimated. For UK operators facing DVSA roadside checks, that verifiability matters.
Fuel management systems, when integrated with telematics mileage data, allow you to calculate accurate cost-per-mile figures and identify vehicles consuming fuel above their expected rate. The corporate transportation sector is increasingly adopting integrated platforms that combine these data streams, reflecting a wider shift away from siloed tools toward unified operational intelligence.
Pro Tip: Match your technology to your fleet size and operational complexity. A 10-vehicle van fleet needs a different setup than a 150-vehicle mixed HGV and trailer operation. Start with GPS tracking and tachograph integration, then add fuel management and dashcams as your data maturity grows.
How can fleet managers use productivity data to improve operational efficiency?
Measuring fleet efficiency is only useful if the data drives decisions. The measurement process and the improvement process must be connected.
Start by identifying your worst-performing assets. Sort your fleet by cost per mile and vehicle uptime percentage. The vehicles at the bottom of both lists are your priority. They may need maintenance attention, driver reassignment, or a TCO review to determine whether replacement is more cost-effective than continued repair.
Fleet utilisation rate targets of 75%–80% represent the practical balance between keeping assets productive and maintaining operational buffers. A utilisation rate above 85% suggests you have too few vehicles for your workload, which increases breakdown risk and driver fatigue. A rate below 70% suggests underused assets that are costing you money without generating revenue.
Practical steps for day-to-day productivity improvement include:
- Review MTBF trends monthly to catch vehicles entering a high-failure cycle before they cause contract disruptions
- Cross-reference driver behaviour scores with fuel consumption data to identify drivers whose habits are inflating your cost per mile
- Set automated alerts for vehicles approaching scheduled maintenance intervals rather than waiting for the next manual review
- Reconcile tachograph records with GPS data weekly to catch discrepancies before they become compliance issues
- Use utilisation data to right-size your fleet at contract renewal points, removing chronically underused assets
The iterative process matters as much as the individual actions. Set a KPI baseline, implement a change, measure the result after 30 days, and adjust. This cycle is how fleet managers translate data into sustained cost reductions rather than one-off improvements. Dashboards designed around weekly operational decisions are the most effective tool for maintaining this discipline, because they keep the relevant metrics visible at the frequency decisions are actually made.
Improving MTTR by even a few hours per incident has a compounding effect on uptime. A fleet of 50 vehicles experiencing two breakdowns per month, each with an MTTR of 8 hours, loses 800 vehicle-hours per year to repair time alone. Cutting MTTR to 5 hours recovers 300 of those hours. At typical HGV revenue rates, that recovery is worth tens of thousands of pounds annually.
Key takeaways
Effective fleet productivity measurement requires integrating accurate, real-time data from multiple sources into a focused set of KPIs that directly inform weekly operational decisions.
| Point | Details |
|---|---|
| Prioritise a focused KPI set | Build your dashboard around utilisation, uptime, cost per mile, MTBF, and MTTR for the clearest operational picture. |
| Fix data fragmentation first | Audit all data sources, including informal channels, before trusting your KPI figures. |
| Use real-time integration | Connecting telematics, CMMS, fuel cards, and driver logs in one platform reduces cost per mile and improves uptime. |
| Act on utilisation data | Target 75%–80% utilisation to balance asset productivity with operational resilience. |
| Close the MTTR gap | Measure repair time from first fault report, not work order creation, to get accurate responsiveness data. |
Why most UK fleets are measuring the wrong things
I have spoken with fleet managers running operations from 15 vehicles to over 200, and the pattern I see most often is the same. The dashboard is full. There are metrics everywhere. And yet the decisions being made on Monday morning are still based on gut feel and the loudest voice in the room.
The problem is not a lack of data. The problem is that most fleets measure what is easy to collect rather than what is decision-critical. Telematics gives you location and speed almost automatically, so those metrics dominate the screen. But the questions that actually cost money, which vehicles are about to fail, which drivers are burning excess fuel, which assets are sitting idle while others are overworked, often require data that takes more effort to capture and integrate.
The informal data problem is worse than most operators realise. When a driver radios in a fault and the transport office handles it verbally, that event is invisible to your KPIs. Your MTTR looks fine. Your uptime looks fine. But the yard reality is different. I would encourage every fleet manager to spend one week logging every informal operational communication and then ask honestly how much of that activity is reflected in their dashboard.
The UK fleet management sector is adopting telematics at pace, but technology adoption without data discipline produces expensive dashboards that do not change behaviour. Tailor your KPIs to your specific operational goals, fix your data sources, and review your metrics at the frequency decisions are actually made. That combination is what separates operators who measure fleet performance from operators who genuinely improve it.
— Vytautas
How Fleetalyse supports real-time fleet productivity measurement
Fleetalyse is built for UK fleet operators who need accurate, real-time data without the complexity of enterprise software that requires specialist IT support. The platform combines GPS vehicle tracking, smart dashcams, tachograph integration, and driver behaviour monitoring in a single system designed around DVSA compliance requirements.
Whether you operate HGVs, vans, trailers, or a mixed fleet, Fleetalyse gives you the live KPI visibility needed to reduce downtime, control cost per mile, and meet your Operator Licence obligations. Hardware is plug-and-play, UK support is included, and setup does not require a professional installer. Visit Fleetalyse to book a demo or start a free trial tailored to your fleet size and operational needs.
FAQ
What is fleet productivity measurement?
Fleet productivity measurement is the process of tracking KPIs such as vehicle uptime, asset utilisation, cost per mile, MTBF, and MTTR to quantify how effectively a fleet operates. It uses telematics, CMMS, and integrated dashboards to turn raw data into operational decisions.
Which KPIs matter most for measuring fleet efficiency?
Vehicle uptime percentage, asset utilisation rate, cost per mile, and MTTR are the four KPIs with the most direct impact on daily operational decisions and cost control. A focused scorecard built around these metrics outperforms a dashboard overloaded with secondary indicators.
How does telematics improve fleet performance metrics?
Telematics captures real-time data on location, speed, idling, mileage, and engine diagnostics, feeding live figures into KPI dashboards. When integrated with tachograph records and fuel card data, telematics closes the data gaps that cause metrics to misrepresent actual fleet activity.
What is a good vehicle utilisation rate for a UK fleet?
The standard target for corporate and commercial fleets is 75%–80% utilisation. Rates above 85% indicate capacity strain, while rates below 70% suggest underused assets that are adding cost without generating sufficient return.
Why are MTTR figures often inaccurate in fleet management systems?
MTTR is frequently understated because repair time measurement begins when a formal work order is opened rather than when the driver first reported the fault. That gap can range from 30 minutes to several hours, making workshop responsiveness appear better than it actually is.