

Fleet size optimisation: a practical guide for 2026

Fleet size optimisation is defined as the process of aligning the number and composition of vehicles in your fleet with actual operational demand, so every asset earns its place. Known formally as fleet rightsizing in operations research, it sits at the intersection of utilisation data, service reliability, and cost control. Get it wrong in either direction and you pay the price: too many vehicles means dormant capital and inflated maintenance bills; too few means missed deliveries and lost contracts. This guide gives fleet operators and logistics managers a clear, data-driven framework for understanding what is fleet size optimisation and how to act on it.
What is fleet size optimisation and why does it matter?
Fleet size optimisation is not simply cutting vehicles to reduce costs. Right-sizing means aligning vehicles to demand for efficiency and productivity improvements, not just trimming headcount. That distinction matters enormously in practice. A fleet reduced without demand analysis will create service gaps within weeks.
The importance of fleet optimisation becomes clear when you look at the financial exposure on both sides. Oversized fleets carry dormant expenses: insurance, depreciation, storage, and scheduled maintenance on vehicles that rarely move. Undersized fleets generate lost revenue, penalty clauses, and reputational damage. Fleet sizing balances lost revenue from undersizing against dormant expenses from oversizing. That balance is the core challenge every logistics manager faces.

Telematics data is the foundation that makes this balance achievable. 83% of fleet operators use telematics data as a foundational requirement for data-driven fleet sizing. That figure tells you the industry has already moved beyond spreadsheets and gut instinct as primary tools.
How do you calculate the optimal fleet size?
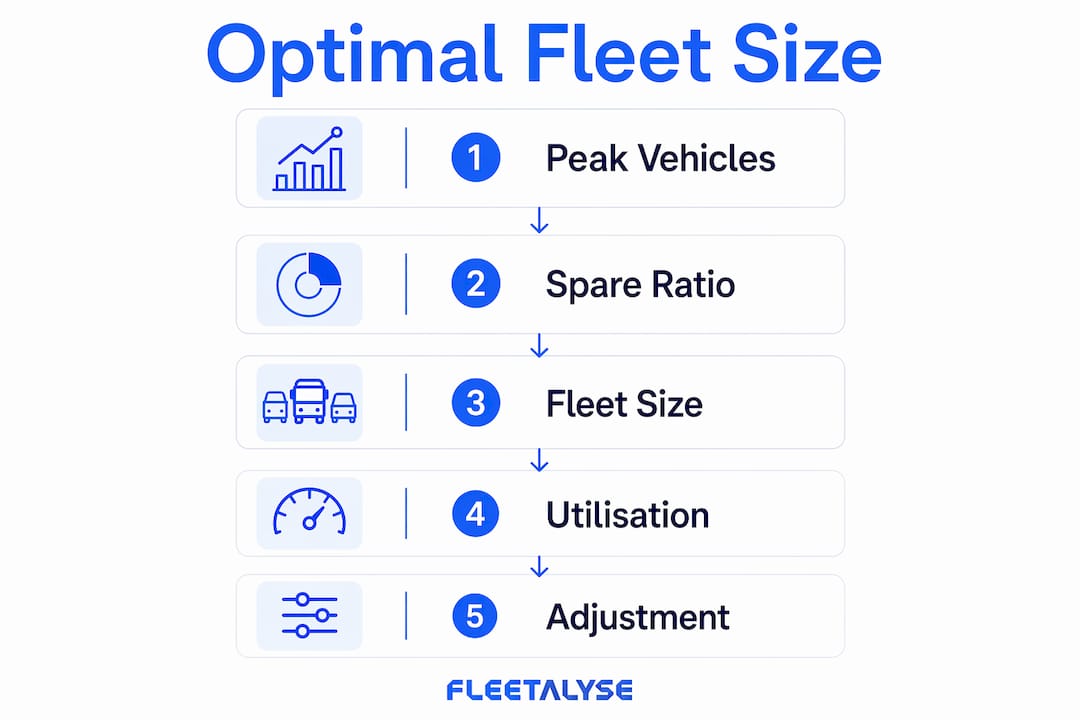
The starting point is peak vehicle requirement, which is the maximum number of vehicles you need simultaneously during your busiest operational period. From there, you apply a spare ratio to cover maintenance downtime and unexpected demand surges.
A straightforward calculation works as follows:
- Identify peak demand. Analyse your busiest week or day across a full 12-month period. Count the maximum vehicles deployed simultaneously.
- Calculate your utilisation rate. Divide active vehicle hours by total available vehicle hours. A rate below 60% signals overcapacity in that asset class.
- Apply a spare ratio. An optimal spare ratio commonly ranges between 10–20% to balance maintenance needs and avoid idle fleets. Add this buffer to your peak requirement.
- Adjust for seasonality and growth. If your operation peaks in Q4 or during harvest periods, model two scenarios: standard demand and peak demand. Build your fleet plan around the gap between them.
The table below illustrates how spare ratio affects total fleet size across three demand scenarios:
| Scenario | Peak Vehicles Required | Spare Ratio | Total Fleet Size |
|---|---|---|---|
| Low demand | 20 | 15% | 23 |
| Standard demand | 35 | 15% | 41 |
| Peak demand | 50 | 10% | 55 |
Applying a lower spare ratio at peak demand is deliberate. During peak periods, vehicles are in constant rotation, so the maintenance window is shorter and the risk of idle assets is lower. Adjusting the ratio by scenario prevents you from permanently inflating your fleet to cover a six-week annual peak.
Pro Tip: Run your utilisation analysis by asset class, not just total fleet. HGVs, vans, and trailers often have very different utilisation profiles. Treating them as one pool will mask significant inefficiencies in individual categories.
What strategies and technologies drive fleet size management?
The most effective fleet management strategies combine real-time telematics with structured analytical methods. Here is how the leading approaches work in practice:
- GPS and telematics monitoring. Real-time vehicle tracking data shows you exactly when, where, and how long each vehicle is active. This replaces assumptions with facts when you are making decisions about which assets to retain or release.
- AI and predictive analytics. Advanced analytics and telematics together enable predictive demand forecasting and optimisation recommendations. AI models can identify patterns in historical usage that human analysts would miss across large fleets.
- Operations research and machine learning. Combining operations research and machine learning allows simulation of thousands of scenarios to optimise fleet composition under uncertainty. This is particularly valuable for logistics operators with seasonal or unpredictable demand cycles.
- Vehicle mix optimisation. Choosing the right vehicle types is as important as choosing the right number. A fleet of uniformly large HGVs serving mixed urban and rural routes will always carry excess capacity on urban legs. Introducing smaller vans for last-mile delivery segments reduces cost per delivery without reducing service coverage.
- Flexible mobility solutions. Vehicle-sharing and Mobility-as-a-Service increase fleet utilisation and reduce costs and environmental impact. For operators with predictable off-peak troughs, shared vehicle pools can replace owned assets in lower-demand periods.
Gradual adjustment is the safest implementation path. Releasing vehicles in batches, rather than all at once, gives you time to monitor service levels and reverse course if demand data proves incorrect.
Pro Tip: Before committing to a vehicle mix change, use your telematics platform to model at least six months of historical route data. Short-term patterns are misleading. Six months captures seasonal variation and gives you a reliable baseline for decisions.
What are the benefits and challenges of fleet optimisation?
The benefits of fleet optimisation are well documented in real-world case studies. The City of Stamford downsized its passenger fleet from 80 to 29 vehicles, generating £560,000 in savings over two years. A utility company reduced total fleet size by 27% in 27 weeks without compromising service by aligning vehicle mix with field productivity. These are not outliers. They reflect what happens when utilisation data replaces assumption-based fleet planning.
The core benefits break down as follows:
- Reduced capital expenditure. Fewer vehicles means lower acquisition costs, reduced depreciation, and smaller insurance premiums.
- Lower maintenance and fuel costs. Each vehicle removed from the fleet eliminates its scheduled servicing, tyre replacement, and fuel consumption.
- Improved service reliability. A correctly sized fleet with a well-managed spare ratio delivers more consistent service than an oversized fleet where maintenance is poorly tracked.
- Reduced environmental footprint. Fewer vehicles in operation directly reduces fleet emissions, which matters increasingly under UK transport regulations.
The challenges are equally real. Accurate data collection requires telematics hardware installed across the entire fleet, not just a sample. Demand variability, particularly in sectors like construction or seasonal logistics, makes forecasting genuinely difficult. Organisational resistance is common: drivers and depot managers often push back against fleet reductions because they associate fewer vehicles with reduced operational security.
Successful fleet optimisations maintain service levels by applying a spare ratio specifically for maintenance and peak needs rather than excess idle capacity. The spare ratio is a precision tool, not a comfort blanket.
How do you implement fleet size optimisation in practice?
A structured implementation reduces risk and builds internal confidence in the process. Follow these steps to move from analysis to action:
- Collect baseline data. Deploy telematics across your full fleet and gather at least three to six months of usage data. Record vehicle utilisation rates, idle time, route distances, and peak deployment periods by asset class.
- Engage operational stakeholders. Speak with depot managers, drivers, and logistics planners before drawing conclusions. They hold contextual knowledge that raw data cannot capture, such as informal vehicle reservations or route-specific requirements.
- Pilot on a defined segment. Piloting optimisations in specific asset classes or regions helps validate assumptions before broader enterprise rollouts, reducing operational risk. Start with the asset class showing the lowest utilisation rate.
- Monitor and adjust continuously. Fleet optimisation is not a one-time project. Use AI and machine learning tools to monitor utilisation in real time and flag when demand patterns shift. Build a quarterly review cycle into your fleet management calendar.
- Communicate clearly across the organisation. Change management is as important as data analysis. Explain the rationale for fleet adjustments to drivers and managers, and provide training on any new telematics or reporting tools introduced during the process.
- Account for compliance requirements. UK operators working under DVSA regulations and Operator Licence conditions must factor compliance obligations into fleet planning. Removing vehicles that carry specific certifications or equipment requires careful sequencing.
For logistics operators scaling their operations, the guide to optimising logistics for scalable growth from ParcelPlanet provides useful context on how fleet decisions interact with broader supply chain planning.
Pro Tip: Set a utilisation threshold before you start. Decide in advance that any vehicle averaging below 50% utilisation over six months is a candidate for release. Having a pre-agreed rule removes the politics from individual vehicle decisions.
Key takeaways
Fleet size optimisation delivers measurable cost savings and service improvements only when it is grounded in accurate utilisation data and a disciplined spare ratio strategy.
| Point | Details |
|---|---|
| Define rightsizing correctly | Fleet optimisation means aligning vehicles to demand, not simply reducing numbers. |
| Apply a spare ratio | Maintain a 10–20% spare ratio to cover maintenance windows and demand peaks. |
| Use telematics as your foundation | 83% of fleet operators rely on telematics data for data-driven sizing decisions. |
| Pilot before full rollout | Test optimisation on one asset class or region before committing to fleet-wide changes. |
| Review continuously | Build quarterly utilisation reviews into your fleet management calendar to catch demand shifts early. |
The uncomfortable truth about fleet optimisation
I have worked with fleet operators who spent months building detailed rightsizing models, only to shelve the results because a depot manager raised concerns about “not having enough cover.” That pattern is more common than the industry admits.
The data is rarely the problem. In almost every case I have seen, the utilisation numbers clearly show which vehicles are surplus. The challenge is that fleet size has become a proxy for operational security in the minds of many managers. More vehicles feels safer, even when the data proves otherwise. Dynamic and uncertain demand environments require advanced simulation and machine learning to optimise fleet size effectively. That is true. But the bigger barrier is often cultural, not technical.
My practical advice is this: start with the spare ratio conversation, not the reduction conversation. When you frame the discussion around maintaining a deliberate 15% buffer for maintenance and peaks, rather than “cutting vehicles,” you get a very different response from operational teams. The outcome is the same. The path to agreement is much smoother.
Looking ahead, the arrival of electric vehicles, autonomous delivery robots, and e-bike GPS trackers for last-mile assets will require entirely new optimisation models. The cost structures, maintenance cycles, and utilisation patterns of these assets differ fundamentally from diesel HGVs. Operators who build data-driven fleet management habits now will adapt far more quickly when those asset types become mainstream.
— Vytautas
How Fleetalyse supports your fleet optimisation
Accurate fleet size decisions start with accurate data. Fleetalyse gives UK fleet operators the telematics foundation that makes rightsizing possible: real-time GPS tracking, driver behaviour monitoring, and automated utilisation reporting across HGVs, vans, and trailers.
The Fleetalyse platform connects your vehicles, routes, and driver activity into a single operational view, so you can identify underutilised assets, model spare ratio scenarios, and act with confidence. Whether you are managing a mixed fleet of 20 vehicles or a national operation with hundreds of assets, Fleetalyse provides the visibility you need to make every vehicle earn its place. Explore the full range of fleet management solutions and see how telematics data can drive your next optimisation review.
FAQ
What is fleet size optimisation in simple terms?
Fleet size optimisation is the process of matching the number and type of vehicles in your fleet to actual operational demand. The goal is to avoid both overcapacity, which wastes money, and undercapacity, which compromises service.
What is a good vehicle utilisation rate for fleet management?
A utilisation rate below 60% typically signals overcapacity in that asset class. Vehicles consistently below this threshold are strong candidates for release or redeployment during a rightsizing review.
How much spare capacity should a fleet maintain?
An optimal spare ratio ranges between 10–20% of active fleet size. This buffer covers scheduled maintenance, unexpected breakdowns, and short-term demand peaks without creating permanent idle capacity.
How long does fleet size optimisation take to implement?
A utility company achieved a 27% fleet reduction in 27 weeks without service disruption. Timescales vary by fleet size and data maturity, but a phased pilot approach typically delivers initial results within three to six months.
What data do i need to start optimising fleet size?
You need at minimum three to six months of telematics data covering vehicle utilisation rates, idle time, peak deployment periods, and route distances by asset class. GPS tracking and fleet management software are the standard tools for collecting this data reliably.