

Logistics fleet efficiency explained for UK operators

Logistics fleet efficiency is defined as the strategic optimisation of vehicles, drivers, and operational processes to reduce fuel, time, and resource waste while maintaining high service quality. For UK fleet managers, this means treating every vehicle as a productive asset rather than a cost centre. Fleet management turns vehicles into strategic assets through real-time data, smart routing, fuel management, and performance monitoring. Platforms like Fleetalyse, alongside tools such as GPS vehicle tracking and integrated analytics, give operators the granular visibility needed to act on inefficiencies before they compound into significant losses.
What are the main factors affecting fleet operational efficiency?
Operational efficiency reduces friction, cost, time, and waste while maintaining service quality. For fleet managers, this translates into a set of measurable indicators that reveal where productivity is being lost.
The key performance indicators (KPIs) every logistics manager should track include:
- Fuel consumption per kilometre: The single most controllable cost variable in most fleets.
- Vehicle availability rate: The percentage of scheduled time a vehicle is actually ready to operate.
- Cost per kilometre: A composite measure of fuel, maintenance, and driver costs relative to distance covered.
- Idle time: Time the engine runs without the vehicle moving, which burns fuel with zero productive output.
- Maintenance compliance rate: Whether scheduled servicing happens on time, preventing costly unplanned breakdowns.
Driver behaviour sits at the centre of all these KPIs. Harsh braking, aggressive acceleration, and excessive speeding each degrade fuel economy and accelerate tyre and brake wear. Documentation accuracy matters too. Tachograph records, driver hours logs, and vehicle inspection reports feed directly into DVSA compliance, and errors here carry financial and licence penalties.
Pro Tip: Track idle time per driver, not just per vehicle. A vehicle with high idle time might reflect one driver’s habits rather than a route or scheduling problem. Addressing the individual is faster and cheaper than redesigning a route.
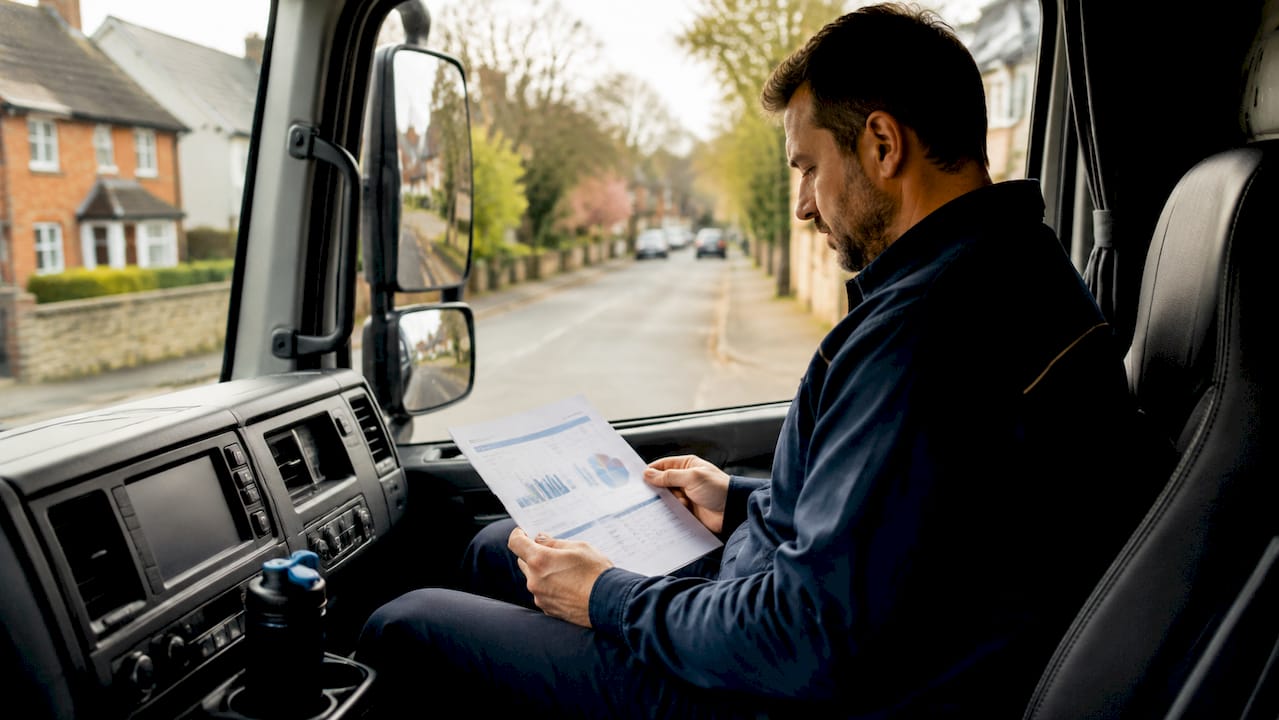
These factors do not operate in isolation. A poorly maintained vehicle burns more fuel. A driver with unchecked behaviour increases maintenance frequency. Understanding how these KPIs interplay is the foundation of any credible fleet operation improvement programme.
How does route optimisation and load planning improve logistics fleet efficiency?
Dynamic route optimisation selects efficient paths using real-time traffic data, delivery windows, and geographic constraints to reduce delays and fuel consumption. For logistics operators running multiple drops per day, the compounding effect of even small routing improvements is substantial.
A practical approach to route and load optimisation follows a clear sequence:
- Audit current routes against actual delivery data. Identify where drivers deviate from planned paths and why.
- Introduce dynamic routing software that adjusts in real time based on traffic incidents, road closures, and customer time windows.
- Apply backhaul planning to ensure vehicles return with loads rather than running empty. Empty mileage is pure cost with zero revenue.
- Sequence stops by geography and time window, not by order of receipt. A logical stop sequence can reduce total distance driven by 15–20% on complex multi-drop routes.
- Review load plans weekly to identify patterns of under-loaded vehicles making trips that could be consolidated.
Load planning is frequently undervalued. A vehicle running at 60% cargo capacity on a route that could be consolidated with another delivery wastes both fuel and driver time. Maximising cargo space per trip directly reduces the number of trips required, which cuts fuel spend, driver hours, and vehicle wear simultaneously.
Pro Tip: Pair route optimisation with real-time depot inventory tracking to align load planning with actual stock availability. Mismatches between planned and actual loads are a common source of wasted journeys.
What strategies reduce fuel waste and idling in fleet operations?
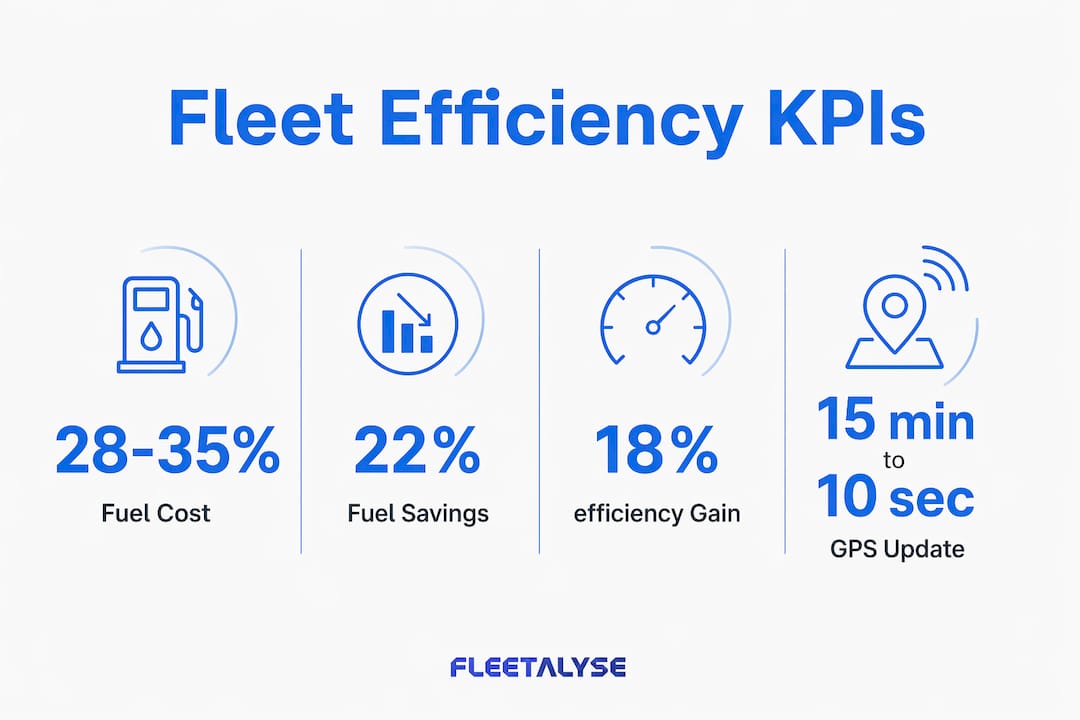
Fuel costs account for approximately 28%–35% of total fleet operational costs. That makes fuel management the highest-leverage area for cost reduction in commercial transport.
Idling is one of the most avoidable sources of fuel waste. A single Class 8 truck can burn £4,000–£6,000 worth of fuel annually through overnight idling alone. Multiply that across a fleet of 50 vehicles and the annual waste becomes a material budget problem.
Effective strategies to reduce fuel waste include:
- Set a clear idling policy. Define the maximum acceptable idle time per stop (typically two to five minutes) and communicate it to all drivers in writing.
- Use telematics to track idling by vehicle and by driver. Aggregate data shows fleet-wide trends; individual data identifies who needs coaching.
- Engage drivers with data, not blame. Share monthly idling reports with drivers and set reduction targets. Drivers who understand the cost impact respond better than those who receive only penalties.
- Schedule proactive maintenance. Under-inflated tyres, dirty air filters, and worn injectors each increase fuel consumption measurably. A well-maintained vehicle burns less fuel on the same route.
- Consider auxiliary power units (APUs) for overnight stops where cab heating or cooling is required, rather than running the main engine.
Effective idling reduction requires clear policy, driver engagement, and measurable tracking by vehicle and driver. The combination of all three is what produces lasting results, not any single measure alone.
What role do telematics and integrated analytics play in enhancing fleet efficiency?
Telematics systems collect vehicle location, speed, driver behaviour, engine status, and maintenance data in real time. The quality of that data depends heavily on how frequently it is updated.
| Update Frequency | Practical Impact |
|---|---|
| Every 15 minutes | Misses short idling events, route deviations, and stop duration detail |
| Every 60 seconds | Captures most events but lags on real-time decision making |
| Every 10 seconds | Enables precise detection of idling, harsh events, and routing deviations |
Improving GPS update frequency from 15 minutes to 10 seconds produced approximately 22% lower fuel costs and 18% higher vehicle utilisation in a documented logistics case study. That is not a marginal gain. It reflects how much operational waste goes undetected when data granularity is too low.
The real power of telematics comes from integration. Fuel data, maintenance records, tachograph downloads, and financial reporting each tell part of the story. Integrating telematics, maintenance, fuel, and financial data into connected workflows closes the loop, allowing managers to assign specific cost impacts to specific behaviours and make decisions with confidence.
Fleetalyse delivers this integration for UK operators, combining GPS tracking, driver behaviour monitoring, remote tachograph downloads, and fuel consumption insights within a single platform. The result is a complete operational picture rather than a collection of disconnected reports.
Pro Tip: When evaluating any telematics platform, ask specifically about update frequency and event granularity. A system reporting every 15 minutes cannot support the tight efficiency controls that modern fleet management demands.
How do terrain and powertrain choices influence fleet efficiency?
Average fuel efficiency figures are misleading without route and terrain context. Diesel truck fuel efficiency swings approximately 30% between flat and mountainous terrain, according to NACFE’s Run on Less programme. Electric trucks experience even greater variation, with efficiency swings of 50%–70% depending on gradient and load.
| Powertrain | Flat Terrain Efficiency | Mountainous Terrain Efficiency | Variation |
|---|---|---|---|
| Diesel Class 8 | Baseline | ~30% lower | Significant |
| Battery Electric | Baseline | 50%–70% lower | Very significant |
| Hydrogen Fuel Cell | Baseline | Moderate variation | Moderate |
This has direct implications for fleet strategy. A battery electric vehicle that performs well on motorway distribution routes may be a poor fit for hilly regional delivery circuits. One-size-fits-all efficiency strategies fail; fleets must match powertrain technologies to terrain and duty cycles for genuine performance gains.
Building operational analytics models segmented by route profile and terrain type is the correct approach. This means analysing your actual route data, not industry averages, before committing to vehicle procurement decisions. A fleet operating across the Pennines faces fundamentally different efficiency constraints than one running flat motorway corridors in the East Midlands. Procurement decisions made without this analysis routinely produce vehicles that underperform against their specifications.
For depot operational efficiency, the same logic applies. Understanding the terrain profile of your distribution network shapes not just vehicle choice but maintenance scheduling, driver rostering, and load planning.
Key takeaways
Logistics fleet efficiency is achieved through continuous, data-driven management of fuel, routes, driver behaviour, and vehicle utilisation, not through any single technology or one-off intervention.
| Point | Details |
|---|---|
| Track the right KPIs | Monitor fuel per kilometre, idle time, vehicle availability, and cost per kilometre as your core efficiency measures. |
| Route and load planning compound savings | Dynamic routing combined with backhaul planning reduces empty mileage and cuts fuel spend simultaneously. |
| Idling is a measurable, avoidable cost | A single HGV can waste thousands in fuel annually through idling; telematics tracking by driver makes reduction achievable. |
| Telematics update frequency matters | High-frequency data (every 10 seconds) enables precise detection of inefficiencies that 15-minute intervals miss entirely. |
| Match powertrain to terrain | Diesel and electric truck efficiency varies by up to 30–70% across terrain types; procurement decisions must reflect your actual routes. |
Why fleet efficiency is a process, not a project
Most fleet managers I speak with treat efficiency as something to fix once and move on from. That thinking is the root cause of recurring cost problems. Fleet efficiency is a continuous process, and the operators who understand that are the ones consistently outperforming their peers on cost per kilometre.
The biggest shift I have seen in well-run fleets is the move from reactive to proactive management. Reactive fleets respond to breakdowns, fuel overspend, and compliance failures after they happen. Proactive fleets use integrated data to spot the conditions that precede those failures. A vehicle whose fuel consumption has crept up 8% over six weeks is telling you something. If your system is not surfacing that signal, you will not act until the engine fails or the fuel bill arrives.
Cross-silo collaboration matters more than most operators realise. Fuel data sitting in one system, maintenance records in another, and tachograph data in a third produces reports, not decisions. When those data streams connect, you can quantify the cost of a specific driver’s idling habit, or calculate the maintenance saving from switching a route to a better-matched vehicle. That is when fleet management becomes genuinely strategic.
Utilisation is the metric I see most frequently misread. Fleet utilisation is a ratio of productive time to planned time, not a vehicle count. An operator with 40 vehicles running at 60% utilisation does not need 10 more vehicles. They need to rebalance workload across the existing fleet. Over-utilisation is equally costly, accelerating wear and increasing driver fatigue risk. The target is balance, not maximum throughput.
My honest recommendation: start with your telematics update frequency. If your platform reports every 15 minutes, you are managing with a blindfold on for most of the working day. Upgrade the data first. Everything else follows from visibility.
— Vytautas
See how Fleetalyse supports your fleet efficiency goals
If the strategies in this article reflect the improvements you want to make, Fleetalyse gives you the tools to act on them today.
Fleetalyse is a UK-based telematics and compliance platform built specifically for commercial fleet operators. It combines GPS vehicle tracking, driver behaviour monitoring, remote tachograph downloads, and fuel consumption insights in one connected system. Whether you manage HGVs, vans, trailers, or a mixed asset fleet, Fleetalyse provides the real-time visibility and integrated data you need to reduce costs, stay DVSA compliant, and make confident operational decisions. Explore the full range of fleet telematics solutions and see what tighter data control can do for your bottom line.
FAQ
What is fleet operational efficiency in logistics?
Fleet operational efficiency is the ratio of productive output to resource input across vehicles, drivers, and processes. It is measured using KPIs such as fuel consumption per kilometre, vehicle availability, idle time, and cost per kilometre.
How does telematics improve logistics fleet efficiency?
Telematics provides real-time data on vehicle location, driver behaviour, fuel use, and engine status. High-frequency updates (every 10 seconds) enable precise detection of idling, route deviations, and maintenance needs before they escalate into larger costs.
What is the biggest controllable cost in fleet operations?
Fuel accounts for approximately 28%–35% of total fleet operational costs, making it the largest controllable expense. Idling reduction, driver coaching, and proactive maintenance scheduling are the most direct levers for cutting fuel spend.
How does terrain affect fleet fuel efficiency?
Terrain has a significant impact on fuel consumption. Diesel trucks see approximately 30% efficiency variation between flat and mountainous routes, while electric trucks experience 50%–70% variation. Procurement and route planning decisions must account for your specific operational geography.
How do i start improving fleet logistics performance?
Begin by auditing your current KPIs: fuel per kilometre, idle time, vehicle availability, and maintenance compliance. Then assess whether your telematics platform provides sufficient data granularity to act on what you find. Integrating fuel, maintenance, and driver data into a single workflow is the most effective next step.