

What is fleet benchmarking: a 2026 guide for operators

Fleet benchmarking is defined as the strategic process of measuring and comparing a fleet’s operational performance metrics against historical data, industry standards, or competitor fleets to identify inefficiencies and set improvement targets. The recognised industry term is fleet performance evaluation, though fleet benchmarking is the phrase most operators use day to day. For UK transport managers running HGVs, vans, or mixed assets, this process is the difference between reacting to problems and preventing them. Modern telematics platforms, including Fleetalyse, make continuous data capture practical at any fleet size, turning raw vehicle data into decisions that reduce costs and improve compliance.
What is fleet benchmarking and why does it matter?
Fleet benchmarking is the process of planning objectives, collecting accurate data, implementing changes, and reviewing outcomes on an ongoing cycle. It is not a one-off audit. The core purpose is to give fleet managers a clear, evidence-based picture of where their operation stands relative to where it should be.

Without benchmarking, you are managing by instinct. You might know a vehicle is costing more than expected, but you cannot quantify how much more, or why, without a baseline to compare against. Benchmarking converts that instinct into a measurable gap, and a measurable gap can be closed.
The benefits of fleet benchmarking extend across every part of the operation. Safety improves when you track preventable accident rates. Costs fall when you monitor total cost per mile. Compliance strengthens when you measure PM (preventive maintenance) completion rates. Each of these outcomes depends on having reliable data and a consistent method for comparing it.
For UK operators subject to DVSA oversight and Operator Licence requirements, fleet performance evaluation is also a compliance tool. Demonstrating that your fleet meets or exceeds industry benchmarks supports your standing with the Traffic Commissioner and reduces the risk of prohibition notices.
What KPIs should you track when benchmarking fleet performance?
Effective benchmarking requires tracking KPIs across four core domains: safety, operations, maintenance, and finance. Each domain answers a different question about fleet health.
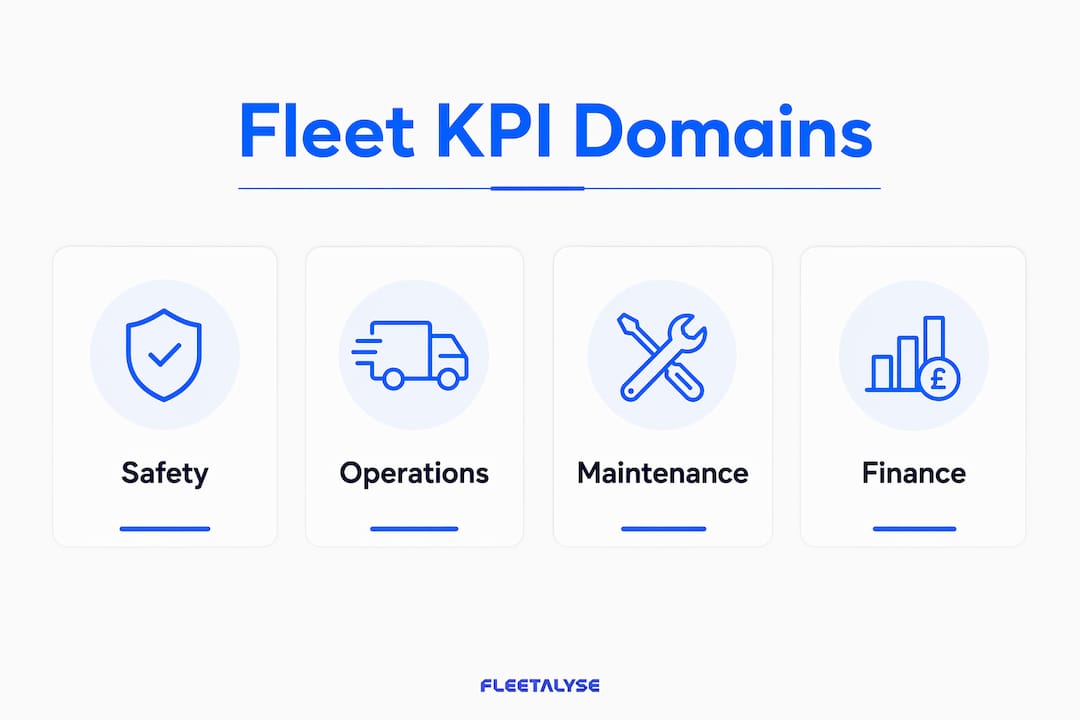
The four core KPI domains
| Domain | Key KPIs | What they reveal |
|---|---|---|
| Safety | Preventable accident rate, near-miss frequency | Driver behaviour and risk exposure |
| Operations | Vehicle utilisation, fleet availability | How efficiently assets are deployed |
| Maintenance | PM compliance rate, MTBF, MTTR | Reliability and repair responsiveness |
| Finance | Total cost per mile, fuel cost per kilometre | True operational cost per unit of output |
Critical assets should maintain an MTBF of 500+ hours and an MTTR under 4 hours, with fleet availability at 95% or higher. These are the 2026 benchmarks that leading operators use as their baseline targets. Falling below 95% availability means vehicles are sitting idle when they should be generating revenue.
Before you set any targets, you need a reliable baseline. Establishing baselines requires at least 90 days of historical data before target setting begins. Ninety days captures seasonal variation, driver rotation, and maintenance cycles, giving you a figure that reflects normal operations rather than a single good or bad week.
Pro Tip: Start with cost per mile and PM compliance rate before adding further KPIs. These two metrics give you the clearest picture of financial health and maintenance discipline, and they are the easiest to act on immediately.
One important detail on MTTR calculation: timing repairs from when issues are first reported by field teams, not when work orders are opened, is the accurate method. Most dashboards miss this distinction, causing systematic underreporting of repair duration. If your MTTR looks impressively low, check whether it is measuring the right start point.
Internal vs external benchmarking: how do they work together?
Fleet benchmarking methods fall into two categories, and the most effective programmes use both.
Internal benchmarking compares performance across your own fleet. You might compare one depot against another, one vehicle class against another, or current performance against the same period last year. This method is straightforward because you control the data, and it reveals relative strengths and weaknesses within your own operation. A depot in Birmingham consistently outperforming one in Leeds on fuel cost per kilometre is a signal worth investigating.
External benchmarking compares your fleet against industry peers, published standards, or sector-wide data. This is harder to execute because reliable external data is not always freely available. Industry associations, telematics providers, and logistics bodies publish aggregate benchmarks that give you a sense of where the sector sits. For UK delivery optimisation in logistics, external benchmarks are particularly useful for setting realistic targets on route efficiency and fuel consumption.
Combining internal, competitive, and industry benchmarking delivers the most comprehensive picture. Internal data tells you where you are relative to yourself. External data tells you where you are relative to the market.
The practical challenge is data collection. Manual processes introduce delays and errors. Integrated fleet management software, particularly telematics platforms that capture GPS position, engine data, and driver behaviour automatically, removes the manual step and produces consistent, timestamped records. Data reliability is remedied by standardised data pipelines and a culture of accountability across the team.
Pro Tip: When starting external benchmarking, focus on one sector-specific benchmark at a time. Trying to compare your fleet across ten external metrics simultaneously produces noise, not insight.
What are the common pitfalls in fleet benchmarking?
Most fleet benchmarking programmes fail not because of bad intentions, but because of predictable, avoidable mistakes. Knowing these pitfalls in advance saves considerable time and money.
-
Treating benchmarking as a quarterly exercise. Continuous, real-time benchmarking reveals performance gaps that periodic reviews miss entirely. A vehicle that develops a fuel consumption problem in week two of a quarter will not appear in a quarterly report until the damage is done. Monthly or weekly review cycles are the minimum for meaningful oversight.
-
The paperwork gap. Between 50% and 90% of actual operational events never reach management systems in fleets that rely on manual recording. Radio calls, verbal updates, and informal handovers disappear before they are logged. Your KPIs then reflect paperwork, not field reality. Real-time event capture through telematics closes this gap directly.
-
Tracking activity volume instead of outcomes. Counting work orders completed is not the same as measuring fleet reliability. True fleet optimisation requires linking KPIs such as total cost of ownership to operational decisions, not just counting how busy the maintenance team is. A fleet that completes 200 work orders a month but has poor MTBF is not performing well. It is generating its own workload.
-
Tracking too many KPIs. Managers should prioritise a small set of high-impact KPIs rather than attempting to measure everything. Excessive reporting creates administrative burden without improving decisions. Five well-chosen metrics, reviewed consistently, outperform twenty metrics reviewed sporadically.
“The goal of benchmarking is not to produce reports. It is to change behaviour and improve outcomes. If your benchmarking data is not driving a specific decision, you are measuring the wrong things.”
- Ignoring data accountability. When drivers and depot managers know that data feeds directly into performance reviews, recording accuracy improves. Standardising data collection processes and cultivating accountability are the two most reliable ways to improve data quality over time.
How do you apply benchmarking data to improve fleet efficiency?
Benchmarking data has no value unless it drives a decision. The application phase is where most of the operational and financial gains are realised.
Start with the KPIs that show the largest gap between your current performance and your target. Managing cost per mile and PM compliance first provides the clearest diagnostics before expanding to fuel use or driver behaviour metrics. A fleet with poor PM compliance will always have inflated repair costs and poor availability. Fix the maintenance discipline first, and other KPIs often improve as a consequence.
Setting realistic targets matters as much as setting ambitious ones. If your current fleet availability is 88%, targeting 95% in one quarter is unlikely without significant investment. A target of 91% in the first quarter, with a clear plan to reach 95% over twelve months, is achievable and keeps the team motivated.
Benchmarking also informs vehicle replacement timing. When a vehicle’s total cost per mile consistently exceeds the fleet average by more than 15%, it is a candidate for early replacement. Holding onto an ageing asset because it is paid off often costs more in maintenance and downtime than a replacement would. Benchmarking makes this case with numbers rather than gut feeling.
For UK operators tracking 2026 courier and logistics trends, benchmarking is also a tool for staying competitive. Sector-wide shifts in fuel costs, driver availability, and regulatory requirements all affect what “good” looks like. Regular external benchmarking keeps your targets calibrated to the current market, not the market of three years ago.
Pro Tip: Review your top three underperforming vehicles by cost per mile every month. These vehicles are almost always responsible for a disproportionate share of total fleet costs. Addressing them first produces the fastest return.
Key takeaways
Fleet benchmarking is only effective when it is continuous, data-driven, and focused on a small number of high-impact KPIs linked directly to operational decisions.
| Point | Details |
|---|---|
| Define your baseline first | Collect at least 90 days of data before setting any performance targets. |
| Focus on four KPI domains | Track safety, operations, maintenance, and finance to get a complete picture of fleet health. |
| Use both benchmarking methods | Combine internal comparisons with external industry standards for the most reliable insights. |
| Close the paperwork gap | Automate data capture through telematics to ensure KPIs reflect field reality, not manual records. |
| Act on the biggest gaps first | Prioritise cost per mile and PM compliance before expanding to additional metrics. |
Fleet benchmarking in practice: my honest assessment
By Vytautas
After working with fleet operators across the UK, the pattern I see most often is this: the data exists, but nobody trusts it. Managers know their spreadsheets are incomplete. Drivers know that not everything gets logged. And so the benchmarking exercise becomes a ritual rather than a tool.
The shift happens when data capture becomes automatic. When a telematics unit records engine hours, fuel consumption, and GPS position without anyone having to type anything, the paperwork gap closes. Suddenly the MTBF figures are real. The cost per mile figures are real. And managers start making decisions based on them.
What I find genuinely underappreciated is the cultural dimension. Technology is the easy part. Getting a depot manager to accept that their fleet’s availability rate is 87% when they believed it was 93% requires trust in the data and a leadership environment where honest numbers are welcomed rather than challenged. Without that culture, even the best telematics platform produces reports that nobody acts on.
The future of fleet performance evaluation is predictive. AI-enabled analytics are already identifying which vehicles are likely to fail before they do, based on patterns in engine data and maintenance history. The operators who build strong benchmarking foundations now, with clean data and consistent processes, will be the ones who benefit most from those tools as they mature.
My advice: start smaller than you think you need to. Pick three KPIs. Automate their capture. Review them weekly for three months. By the end of that period, you will know exactly which metrics matter for your specific operation, and you will have the confidence to expand from there.
— Vytautas
How Fleetalyse supports continuous fleet benchmarking
If your benchmarking programme is only as good as your data, then the quality of your data capture is the most important investment you can make. Fleetalyse provides UK fleet operators with GPS tracking and telematics solutions designed to automate the data collection that manual processes consistently miss.
The Fleetalyse platform captures real-time vehicle position, driver behaviour, fuel consumption, and engine diagnostics across HGVs, vans, trailers, and mixed assets. Smart dashcams add a visual layer to driver behaviour data, supporting both safety benchmarking and incident investigation. Automated KPI reporting removes the administrative burden from your team and produces consistent, timestamped records that you can trust. Explore the full range of fleet telematics solutions to see how continuous monitoring fits your operation.
FAQ
What is the fleet benchmarking definition?
Fleet benchmarking is the process of measuring a fleet’s operational performance against historical data, industry standards, or competitor fleets to identify inefficiencies and set improvement targets. It covers safety, operations, maintenance, and finance KPIs.
How do you benchmark a fleet effectively?
Collect at least 90 days of baseline data, select a small set of high-impact KPIs such as cost per mile and PM compliance, then compare results against internal targets and external industry standards on a continuous basis.
What are the most important fleet performance indicators?
The most critical fleet performance indicators are MTBF (target 500+ hours), MTTR (target under 4 hours), fleet availability (target 95% or higher), preventable accident rate, and total cost per mile.
Why is continuous benchmarking better than periodic reviews?
Periodic reviews miss performance gaps that develop between reporting cycles. Continuous, real-time monitoring captures events as they happen, ensuring KPIs reflect actual field conditions rather than a snapshot that may not represent normal operations.
What is the paperwork gap in fleet data?
The paperwork gap refers to the 50–90% of operational events that never reach management systems in fleets relying on manual recording. Telematics platforms that automate data capture eliminate this gap and produce accurate KPIs.