

Fleet total cost of ownership: the 2026 UK guide

Fleet total cost of ownership (TCO) is defined as the complete sum of every cost incurred across a vehicle’s lifecycle, from acquisition through operation to final disposal. The industry standard term is TCO, and understanding what is fleet total cost ownership means accounting for depreciation, fuel, maintenance, insurance, administration, and residual value in a single financial figure. Without this full picture, fleet managers routinely underestimate budgets and make vehicle decisions based on purchase price alone. That approach costs more in the long run, and the data proves it.
What is fleet total cost of ownership?
TCO converts fragmented cost data into a single per-mile or per-year figure, enabling valid comparisons between vehicles and between fleets. Without TCO, a cheaper upfront purchase can produce higher operational costs over three to five years. This is the core problem fleet managers face when they rely on invoice price rather than lifecycle cost.
The practical value of TCO is that it forces every cost category into one calculation. Fuel, maintenance, insurance, depreciation, and disposal value all carry weight. Ignoring any one of them distorts the result and leads to suboptimal decisions on replacement timing, vehicle selection, and budget allocation.
What cost elements make up the fleet total cost of ownership?
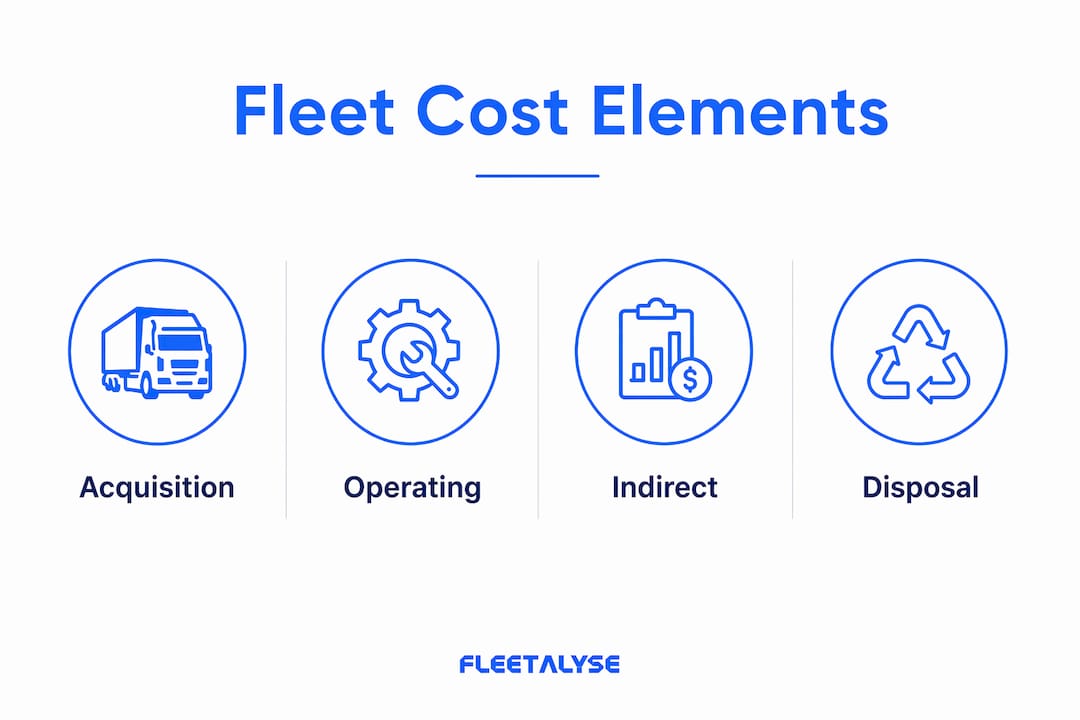
Fleet management expenses fall into four broad categories: acquisition, operating, indirect, and disposal costs. Each category contains costs that are easy to overlook when you focus only on monthly invoices.
Acquisition costs
Acquisition costs include the purchase price, VAT, road tax, and any licensing or registration fees. For HGVs and specialist vehicles, these figures are substantial before the vehicle turns a wheel. Finance charges and arrangement fees also belong here if you are purchasing outright or through a hire purchase agreement.
Operating costs
Fuel consumption often represents up to 25% of a fleet’s total operating budget. That single figure makes fuel the most variable and most impactful line item in any TCO calculation. Maintenance, tyres, repairs, insurance premiums, and driver wages sit alongside fuel as recurring operating costs. Reducing fleet insurance costs through telematics data and driver behaviour monitoring directly reduces this category.

Indirect and hidden costs
Indirect costs are where most fleet managers lose money without realising it. Downtime, roadside assistance call-outs, driver training, and administrative overhead rarely appear on a single invoice. Self-reported fleet costs average around 14%, while third-party audits reveal figures closer to 38%, with up to 41% of fleets omitting key cost categories entirely. That gap is significant. It means the majority of fleet operators are working with an incomplete financial picture.
Disposal costs and residual value
Disposal costs include the cost of decommissioning, selling, or scrapping a vehicle, offset by its residual value. Annual depreciation is calculated as the purchase price minus the resale value, divided by the number of years owned. Getting this figure right matters because it directly affects the net cost of ownership and the timing of replacement decisions.
| Cost category | Examples |
|---|---|
| Acquisition | Purchase price, VAT, licensing, finance charges |
| Operating | Fuel, maintenance, tyres, insurance, driver wages |
| Indirect | Downtime, roadside assistance, admin, driver training |
| Disposal | Decommissioning costs, offset by residual/resale value |
Pro Tip: Track each cost category in a separate ledger from day one. Mixing categories is the fastest way to lose visibility over where your money is actually going.
How does fleet total cost ownership compare between owning and leasing vehicles?
The ownership versus leasing decision is fundamentally a TCO question. Owning a commercial vehicle costs an average of $0.80 per mile, while leasing averages $0.65 per mile. That represents a potential saving of up to 19% through leasing. In a UK context, the equivalent gap is meaningful across a fleet of any size.
Ownership carries higher upfront capital requirements and places all maintenance risk on the operator. When a vehicle needs an unexpected repair, that cost falls directly on your balance sheet. Leasing transfers some of that risk to the lessor, and monthly costs are predictable, which simplifies budgeting.
The drawback of leasing is that you build no residual asset value. At the end of the contract, you return the vehicle with nothing to show for the payments made. Ownership, by contrast, retains an asset that can be sold to offset the cost of a replacement.
| Cost factor | Ownership | Leasing |
|---|---|---|
| Upfront capital | High | Low |
| Monthly cost predictability | Variable | Fixed |
| Maintenance responsibility | Operator | Shared or lessor |
| Residual asset value | Yes | No |
| Administrative overhead | Higher | Lower |
Pro Tip: Run a TCO model for both options over a five-year period before committing. The monthly lease payment is rarely the full picture once you factor in mileage penalties and condition charges at contract end.
Operators with older fleets and high mileage profiles often find that reducing insurance premiums through telematics evidence shifts the ownership model back into competitive territory. The right answer depends on your specific fleet profile, not a general rule.
What practical steps can fleet managers take to calculate and monitor fleet TCO?
Accurate fleet cost analysis follows a seven-step process that converts raw data into a reliable TCO figure. Each step builds on the last, and skipping any one of them introduces errors that compound over time.
-
Gather all cost data. Collect fuel card records, maintenance invoices, insurance schedules, finance agreements, and driver expense claims. Include roadside assistance call logs and any administrative costs tied to fleet management.
-
Categorise every expense. Assign each cost to one of the four categories: acquisition, operating, indirect, or disposal. This step reveals which categories you have been underreporting.
-
Calculate total cost of ownership and cost per mile. Cost per mile (CPM) equals total fleet costs divided by total miles driven. This normalises costs against usage and allows direct comparison between vehicles of different types and ages.
-
Benchmark against industry figures. Compare your CPM and TCO figures against sector averages. A significant gap above the benchmark signals an inefficiency worth investigating.
-
Identify specific inefficiencies. High fuel costs point to driver behaviour or route planning issues. High maintenance costs point to ageing vehicles or poor servicing schedules. Pinpoint the cause before acting.
-
Build an action plan. Set targets for each cost category and assign responsibility. Vague intentions do not reduce costs. Specific targets with named owners do.
-
Review regularly. Regular reviews of fuel efficiency and maintenance records reduce costs cumulatively across large fleets. A quarterly review cycle is the minimum for any fleet above ten vehicles.
Telematics platforms like Fleetalyse provide the real-time data that makes steps one through seven practical rather than theoretical. GPS tracking, driver behaviour monitoring, and fuel consumption reporting feed directly into your cost categories without manual data entry. The Fleetalyse solutions platform integrates tachograph data, vehicle tracking, and maintenance scheduling into one view, which removes the data gaps that cause TCO underestimation.
Pro Tip: Set a calendar reminder for your quarterly TCO review on the same date each quarter. Consistency in timing makes year-on-year comparisons meaningful.
What are common misconceptions and overlooked costs in fleet total cost ownership?
The most damaging misconception in fleet cost analysis is that the purchase price represents the primary cost of a vehicle. Focusing solely on purchase price is misleading. A vehicle’s low purchase price can mask significantly higher operating costs over its working life.
Several specific costs are routinely omitted from fleet TCO calculations:
- Depreciation. Depreciation is the most overlooked cost until the moment of disposal, when the gap between expected and actual resale value becomes impossible to ignore.
- Administrative overhead. The staff time spent managing compliance, scheduling, and reporting carries a real cost that rarely appears in fleet budgets.
- Roadside assistance. Call-out fees and recovery costs accumulate quickly on older vehicles and are almost never tracked as a fleet cost category.
- Downtime. A vehicle off the road is not just a maintenance cost. It is lost revenue, missed deliveries, and potential contract penalties.
- Driver training. Induction costs, licence renewals, and CPC training are fleet costs that often sit in an HR budget rather than a fleet budget, making them invisible to TCO calculations.
Inaccurate cost data does not just distort your budget. It leads to keeping vehicles too long, replacing them too early, and selecting the wrong assets for your operation in the first place.
Omitting indirect and administrative costs causes fleet TCO to be underestimated by nearly 38% in third-party audits compared to self-reported figures. That is not a rounding error. It is a structural blind spot that affects every financial decision you make about your fleet.
The optimal vehicle replacement window sits at around three years or before 100,000 miles. Replacing too late causes maintenance cost spikes and diminished residual value. Replacing too early sacrifices depreciation recovery. Getting the timing right requires accurate, continuous TCO data, not guesswork.
Key takeaways
Fleet TCO is the only financial metric that captures every cost from acquisition to disposal, making it the definitive tool for vehicle selection, replacement timing, and budget accuracy.
| Point | Details |
|---|---|
| TCO covers the full lifecycle | Include acquisition, operating, indirect, and disposal costs in every calculation. |
| Hidden costs are the biggest risk | Indirect costs like downtime and admin cause underestimation of up to 38% in audited fleets. |
| Leasing can save up to 19% per mile | Ownership averages more per mile; leasing offers predictable costs but no residual asset value. |
| Replace vehicles at the right time | The three-year or 100,000-mile window balances residual value, maintenance costs, and tax benefits. |
| Regular reviews compound savings | Quarterly TCO reviews using telematics data reduce costs cumulatively across the whole fleet. |
Why most fleet managers are working with the wrong numbers
I have spoken with fleet managers running operations from five vans to five hundred HGVs, and the pattern is consistent. They know their fuel bill. They know their insurance renewal date. What they do not know is their actual cost per mile, and that single gap undermines every financial decision they make.
The temptation is to treat TCO as a finance department exercise, something you do once a year when budgets are set. That approach is wrong. TCO is a live operational tool. The moment a vehicle develops a recurring fault, your cost per mile for that asset changes. If you are not tracking it continuously, you are making replacement decisions on stale data.
I have seen operators hold onto vehicles well past the three-year sweet spot because the maintenance costs had not yet triggered an alarm. By the time they replaced the asset, the cumulative cost of downtime, repairs, and lost residual value had wiped out two years of profit margin on that vehicle.
The other mistake I see regularly is treating depreciation as an accounting abstraction. It is not. It is a real cash cost that you pay at the point of disposal. Operators who model depreciation annually budget for it. Those who ignore it get a nasty surprise when the resale cheque arrives.
Structured TCO modelling, supported by telematics data, is what separates proactive fleet management from reactive cost control. The data is available. The frameworks exist. The only variable is whether you choose to use them.
— Vytautas
How Fleetalyse supports accurate fleet cost management
Controlling fleet costs starts with having reliable data, and that is exactly what Fleetalyse delivers for UK operators.
Fleetalyse provides GPS vehicle tracking, driver behaviour monitoring, and fuel consumption reporting through a single platform built for UK commercial fleets. Real-time telematics data feeds directly into your cost categories, removing the manual data entry that causes gaps in TCO calculations. The Fleetalyse platform supports HGVs, vans, trailers, and mixed assets, with plug-and-play hardware that requires no professional installation. For operators managing asset and trailer tracking alongside powered vehicles, Fleetalyse integrates both into one view. Contact the UK-based support team to discuss how the platform fits your fleet’s specific cost profile.
FAQ
What is fleet total cost of ownership?
Fleet total cost of ownership is the complete sum of all costs incurred across a vehicle’s lifecycle, including acquisition, fuel, maintenance, insurance, administration, and disposal. It converts fragmented expenses into a single per-mile or per-year figure for accurate financial comparison.
What costs are most commonly missed in fleet TCO?
Indirect costs including administrative overhead, roadside assistance, downtime, and driver training are most frequently omitted. Third-party audits reveal that self-reported fleet costs underestimate TCO by nearly 38% on average.
How do I calculate cost per mile for my fleet?
Cost per mile equals total fleet costs divided by total miles driven across the period. This figure normalises expenses against usage and allows direct comparison between individual vehicles regardless of type or age.
Is leasing or owning cheaper for fleet TCO?
Leasing averages a lower cost per mile than ownership, with potential savings of up to 19%. Ownership retains residual asset value but carries higher upfront costs and places all maintenance risk on the operator.
When is the best time to replace a fleet vehicle?
The optimal replacement window is around three years or before 100,000 miles. Replacing within this window maximises residual value, captures available tax benefits, and avoids the maintenance cost spikes associated with ageing vehicles.