

Vehicle idle time monitoring explained for UK fleets

Vehicle idle time monitoring is the process of tracking how long a vehicle’s engine runs while the vehicle is stationary and performing no productive work. Telematics units compare ignition-on status against GPS movement data in real time, flagging the gap between the two as idle time. A delivery van sitting outside a depot with the engine running, or an HGV warming the cab during a driver break, both count. Both burn fuel and produce emissions for zero output.
The outputs from idle time monitoring systems typically include:
- Idle duration per vehicle, shift, or route
- Location data showing where idling most commonly occurs
- Driver-specific records linking idle events to individual operators
- Trend reports identifying patterns across the fleet over time
Platforms such as Fleetalyse combine GPS vehicle tracking with automated driver behaviour monitoring to deliver these insights within a single compliance-focused dashboard, built specifically for UK transport operators.
How telematics and GPS actually measure idle time
The measurement process starts with the ignition signal. A telematics unit detects when the engine is running and simultaneously reads GPS speed and position data. When the ignition is on but speed reads zero and position is static, the system logs an idle event and begins counting.
That sounds straightforward, but stop-start urban traffic complicates things. A vehicle crawling at 2 mph is not idling, yet GPS speed at that level can be unreliable. To handle this, telematics algorithms incorporate additional sensor inputs:
- Accelerometer data to detect micro-movements that GPS alone might miss
- Engine vibration signals confirming the engine is genuinely running
- Battery voltage readings distinguishing ignition-on from accessory-only power draw
- CAN-bus data on some vehicles, providing direct engine RPM confirmation
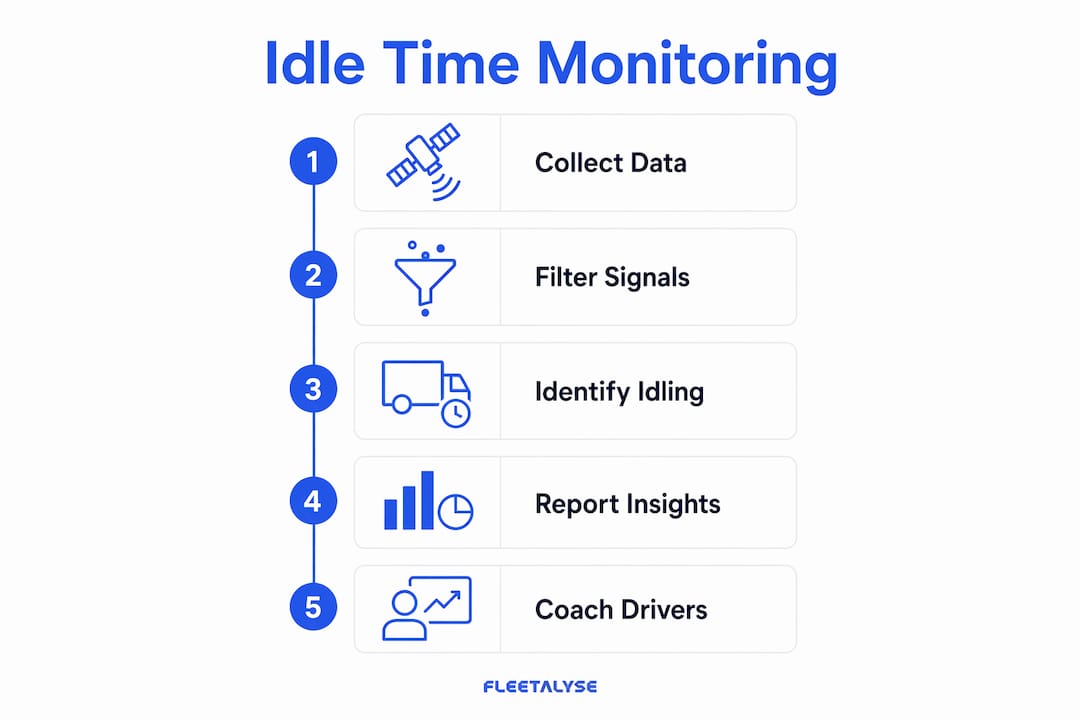
These inputs are combined and filtered so the system can confidently separate genuine idling from slow-moving congestion. The resulting data is aggregated into reports by vehicle, driver ID, time of day, and location, giving fleet managers a structured picture rather than a raw data dump.
Accuracy does have limits. GPS signal quality in urban canyons or covered loading bays can introduce short gaps in position data. Well-designed idle time monitoring systems account for this with configurable minimum idle thresholds, typically set at 60–120 seconds, to filter out brief engine-on events that are not operationally meaningful.
Why UK fleet managers cannot afford to ignore idle time
The fuel cost alone makes idle time management a priority. A diesel HGV idling costs roughly £2–5 per hour in fuel. Across a fleet of 30 vehicles, even modest average daily idling adds up to a controllable cost that shows directly on the fuel bill.
Beyond cost, UK fleet operators face specific regulatory pressure:
- DVSA compliance requires operators to demonstrate responsible vehicle use; excessive idling can surface during operator licence reviews
- Clean Air Zone penalties in cities including Birmingham, Bath, and Bristol apply to vehicles that fail emissions standards, and unnecessary idling worsens those figures
- Corporate carbon reporting obligations mean idle hours feed directly into scope 1 emissions calculations
Driver coaching is another practical gain. Idle time data broken down by driver reveals behavioural patterns that are invisible in aggregate fleet reports. A driver who consistently idles for 40 minutes per shift is a coaching conversation, not a disciplinary matter, and targeted training produces measurable reductions. Fleetalyse supports this by linking idle events to individual driver records, making those conversations evidence-based rather than anecdotal.
The environmental dimension matters too. Fleet operators with sustainability commitments or public sector contracts increasingly need to demonstrate emissions reduction. Idle time is one of the few controllable inputs in that calculation, which makes monitoring it a practical first step rather than a theoretical one.
How to categorise idle time data so it actually drives decisions
Raw idle time totals tell you very little on their own. The insight comes from categorising idle events into distinct buckets before analysis begins.
A practical categorisation framework for UK fleets:
- Necessary operational waits — loading bay queues, customer-required engine-on periods, refrigeration unit demands
- Traffic-related idling — congestion stops in urban routes where the driver has no control
- Avoidable idling — engine left running during driver breaks, pre-shift warm-ups beyond manufacturer guidance, post-delivery delays
Separating these three categories immediately focuses management effort. Avoidable idling is the only category where driver behaviour change produces a direct reduction. Traffic idling points to route planning or scheduling issues. Necessary waits may require operational or customer-side solutions rather than driver coaching.
Pro Tip: Set your telematics platform to flag idle events only after a configurable threshold, typically 90 seconds, to avoid cluttering reports with brief engine-on events at traffic lights. Fleetalyse allows this threshold to be adjusted per vehicle type, which is particularly useful when managing mixed HGV and van fleets.

Combining telematics data with frontline supervisor review catches the inconsistencies that automated systems alone miss. A supervisor who knows a particular depot has a 20-minute mandatory pre-departure check can flag that period as necessary, preventing it from distorting driver performance scores.
Best practices for implementing idle time monitoring
Getting the implementation right from the start saves considerable rework later.
- Define your idle threshold before go-live. A threshold that is too low floods reports with noise; too high and genuine waste goes unrecorded. Sixty to 120 seconds suits most UK van and HGV operations.
- Communicate the programme to drivers before launch. Drivers who understand why idle time is being tracked and how it affects their performance reviews engage with the data rather than resisting it.
- Assign a named reviewer for idle reports. Data that nobody reviews produces no change. A transport manager or fleet supervisor should check idle summaries weekly, not monthly.
- Link idle reduction to positive recognition. Drivers who reduce their idle time should hear about it. Associating the metric with recognition rather than punishment builds the culture that sustains long-term improvement.
- Review hardware placement. A plug-and-play OBD tracker such as the Teltonika FMB003 installs in minutes and provides the ignition, GPS, and accelerometer data needed for accurate idle detection without professional fitting.
Reading idle time reports to cut fuel costs
The most useful idle time reports show three dimensions together: duration, location, and driver. A report showing only total idle hours per vehicle tells you there is a problem. A report showing that the same three drivers idle for over 30 minutes every Tuesday morning at the same postcode tells you exactly where to intervene.
Look for these patterns when reviewing idle data:
- Recurring location clusters often indicate depot layout problems or loading bay bottlenecks rather than driver behaviour
- Time-of-day spikes in early morning can point to cold-start habits that a brief policy change resolves
- Driver outliers who idle significantly more than peers on identical routes are the clearest candidates for one-to-one coaching
Fuel cost reduction follows naturally once the root cause is correctly identified. Addressing a depot bottleneck cuts idle time fleet-wide; coaching one driver cuts it for that individual. Both matter, but they require different responses. The hidden cost of idle equipment extends beyond fuel to maintenance intervals, as engines accumulate hours faster when idling is excessive, affecting service scheduling and asset life.
Fleetalyse gives UK fleet operators real idle time visibility
Idle time data is only as good as the platform presenting it. Fleetalyse brings together GPS tracking, driver behaviour monitoring, and tachograph compliance in one UK-built platform, so your idle time reports sit alongside the rest of your operational data rather than in a separate system.
For HGV operators, the Teltonika FMC650 tracker with the Fleetalyse PAYG platform delivers real-time idle alerts, driver-level reporting, and location-stamped idle events with no long-term contract required. Mixed fleets covering vans, trailers, and HGVs can be managed within the same dashboard, with UK-based support on hand for setup and configuration. If you want to stop paying for fuel your fleet is burning for nothing, the practical next step is to explore the Fleetalyse platform and see which hardware fits your vehicles.
Key takeaways
Idle time monitoring turns engine-on, wheels-stopped data into specific, driver-linked intelligence that UK fleet managers can act on immediately to cut fuel costs and support compliance.
| Point | Details |
|---|---|
| What idle time monitoring measures | Engine-on time with no vehicle movement, tracked by comparing ignition status against GPS position data. |
| Fuel cost of HGV idling | A diesel HGV burns roughly £2–5 of fuel per hour at idle, a directly controllable fleet cost. |
| Categorise before you analyse | Splitting idle events into necessary waits, traffic stops, and avoidable idling focuses coaching where it produces results. |
| Accuracy requires multiple sensors | GPS alone is insufficient; accelerometers, CAN-bus data, and engine vibration signals improve detection in congested conditions. |
| Fleetalyse for UK operators | Fleetalyse links idle events to individual driver records within a compliance dashboard built for DVSA and Operator Licence requirements. |