

Fleet administration cost reduction explained for UK operators

Fleet administration cost reduction is the practice of eliminating hidden and visible expenses in fleet operations through workflow automation, data integration, and optimised asset management. For UK commercial fleet operators, the scale of preventable loss is striking. Manual admin tasks account for 15%–25% of total operations headcount costs. That figure means mid-size fleets can lose up to £300,000 annually on work that technology can largely replace. The strategies covered here address the full cost picture, from compliance paperwork to vehicle utilisation, giving transport managers a clear path to measurable savings.
How does fleet administration cost reduction actually work?
Fleet administration cost reduction works by replacing manual, error-prone workflows with automated systems that capture, process, and report data without human intervention at every step. The industry term for this broader discipline is total cost of ownership (TCO) management. TCO covers every expense across a vehicle’s life, from acquisition and fuel through to maintenance, compliance, and disposal. Reducing admin costs is one of the fastest ways to improve TCO because the savings are immediate and do not require capital investment in new vehicles.
The most common sources of preventable admin expense are duplicate data entry, billing delays, and compliance document handling. Each task appears small in isolation. Collectively, micro-inefficiencies such as re-typing invoices or manually verifying individual documents generate substantial unseen annual costs. A fleet of 50 vehicles running inefficient workflows can absorb the equivalent of one full-time administrator’s salary in wasted effort alone.

Technology removes these costs at the source. Digital inspection forms eliminate paper trails. Automated fuel reconciliation catches discrepancies before they become billing disputes. AI-powered document handling processes compliance certificates and driver licence checks without manual input. The result is fewer errors, faster processing, and a leaner back office.
Pro Tip: Audit your five most time-consuming admin tasks before purchasing any software. Map each task end to end, count the manual steps, and calculate the weekly hours spent. That audit tells you exactly where automation will deliver the fastest return.
Common admin inefficiencies that inflate fleet costs include:
- Duplicate data entry across separate fuel, maintenance, and HR systems
- Manual tachograph data downloads and driver hours calculations
- Paper-based vehicle inspection reports requiring manual transcription
- Compliance certificate renewals tracked through spreadsheets or email
- Billing reconciliation done by hand against multiple supplier invoices
Adding headcount to fix these problems makes them worse, not better. The solution is workflow redesign backed by automation tools, not more staff absorbing the same broken processes.
Why is preventive maintenance compliance vital to reducing repair costs?
Preventive maintenance (PM) compliance is the single highest-leverage cost reduction lever available to most fleet operators. Fleets achieving 90%+ PM compliance spend 44% less on repairs and experience 3.5 times fewer unplanned breakdowns. That is not a marginal improvement. It is the difference between a fleet that controls its workshop spend and one that reacts to crises.
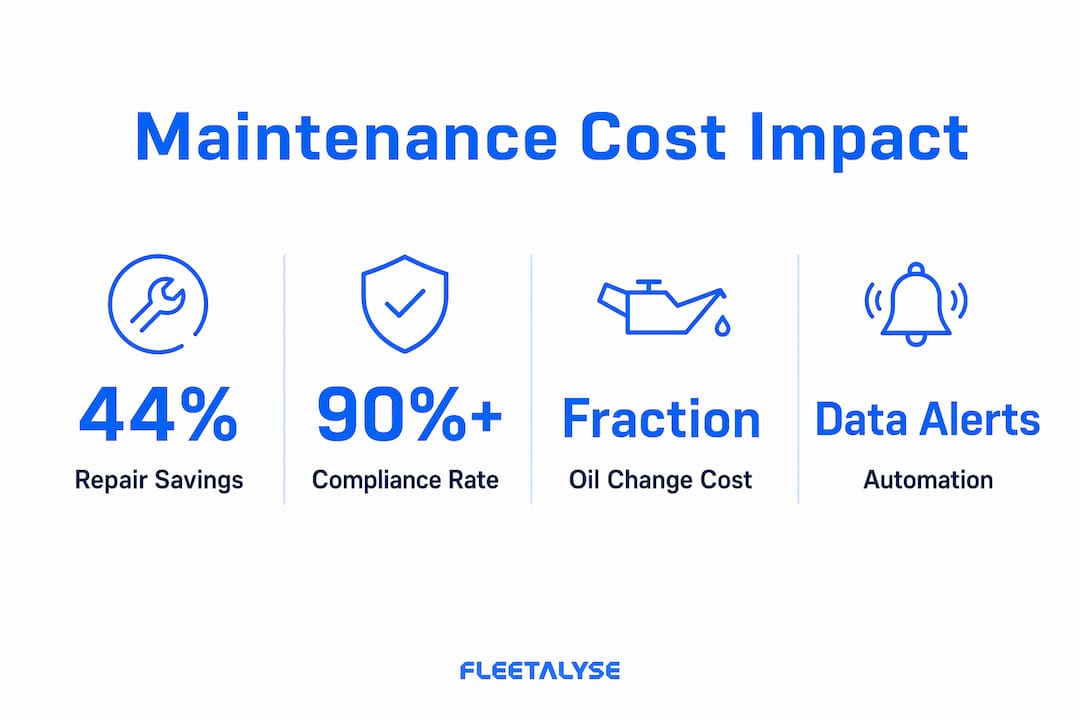
The financial logic is straightforward. A scheduled oil change costs a fraction of the engine damage that follows from skipping it. A brake inspection costs far less than a roadside breakdown, a DVSA prohibition notice, and the knock-on delay to your customer deliveries. Unplanned downtime also carries indirect costs: driver idle time, hire vehicle charges, and reputational damage with clients.
Automated maintenance alerts remove the human memory dependency from PM scheduling. When a vehicle’s service interval is tracked digitally and triggers an alert to the workshop and the fleet manager simultaneously, compliance rates rise because no one needs to remember. Platforms like Fleetalyse integrate maintenance scheduling with real-time vehicle data, so alerts fire based on actual mileage and engine hours rather than calendar estimates.
Pro Tip: Connect your maintenance data directly to your vehicle scheduling system. When the workshop can see which vehicles are due for service before the dispatcher commits them to runs, you avoid the common conflict between operational pressure and maintenance compliance.
| Maintenance approach | Average repair cost impact | Breakdown frequency | Compliance requirement |
|---|---|---|---|
| Reactive only | Baseline high cost | High, unplanned | None |
| Scheduled but manual | Moderate reduction | Moderate | Relies on memory |
| Automated PM compliance at 90%+ | 44% lower than reactive | 3.5x fewer unplanned | System-driven alerts |
How can right-sizing your fleet lower overall running costs?
Fleet right-sizing is the process of matching your vehicle count and type precisely to operational demand, removing assets that carry cost without contributing capacity. Approximately 15%–20% of vehicles in a typical fleet are underutilised. Each idle vehicle still accrues depreciation, insurance premiums, and road tax. Removing or redeploying those assets reduces expenses without affecting service levels.
The counterintuitive finding from utilisation analysis is that operators can often remove half or more of their so-called buffer vehicles with no operational impact. Buffer vehicles exist because managers fear being caught short. Objective data nearly always shows the buffer is larger than the actual risk warrants.
A structured utilisation review follows these steps:
- Pull utilisation data for every vehicle over a rolling 90-day period, recording days in use, mileage, and idle time.
- Classify vehicles into three bands: fully utilised, partially utilised, and consistently idle.
- For partially utilised vehicles, identify whether redeployment to a higher-demand route or depot solves the problem.
- For consistently idle vehicles, calculate the annual cost of retention against the cost of disposal or lease return.
- Model the operational risk of removing idle vehicles using peak demand data from the previous 12 months.
- Execute disposals or returns in tranches, monitoring service impact after each tranche before proceeding.
Lifecycle strategy matters here too. Holding a vehicle beyond its optimal disposal point increases maintenance costs and reduces resale value simultaneously. The right-sizing exercise should include a lifecycle review that identifies vehicles approaching the point where running costs exceed replacement cost savings.
What role does driver behaviour play in fleet cost management?
Driver behaviour is a direct cost driver, not just a safety concern. Aggressive driving increases fuel consumption by 15%–30% and accelerates wear on brakes, tyres, and drivetrain components. Given that fuel represents approximately 35% of total fleet expenditure, a 15% reduction in fuel waste from better driving habits produces a material budget saving across even a modest-sized fleet.
Live driver behaviour monitoring captures the data needed to coach effectively. Without data, driver briefings rely on anecdote and assumption. With data, you can show a specific driver their harsh braking events, idling time, and speed profile over the past week. That specificity changes behaviour far more reliably than a general reminder about fuel efficiency.
Fleetalyse’s driver behaviour monitoring tools provide real-time scoring and event alerts, giving fleet managers the visibility to intervene early rather than discovering problems through fuel bills or workshop invoices. Linking driver scores to maintenance records also reveals which drivers are generating disproportionate component wear, allowing targeted coaching before costs escalate.
Key driver performance metrics to track for cost reduction:
- Harsh braking events per 100 kilometres
- Harsh acceleration frequency
- Excessive idling time as a percentage of engine-on time
- Speeding incidents above posted limits
- Cornering force events indicating aggressive steering
- Fuel consumption per kilometre against fleet average
Incentive programmes reinforce data-driven coaching. Recognising drivers who improve their scores reduces resistance to monitoring and builds a culture where efficiency is valued rather than resented.
How does integrated data management support sustainable cost reduction?
Sustainable fleet cost reduction requires connecting data across vehicle lifecycle planning, maintenance records, driver performance, and fuel consumption into a single, coherent picture. Consistent review and data integration yield measurable control over costs and uptime. Isolated data sets produce isolated improvements. Integrated data produces compounding savings.
The practical difference is significant. A fleet manager reviewing fuel data in one system and maintenance data in another cannot easily see that a vehicle with rising fuel consumption is also overdue for a tyre rotation. An integrated platform surfaces that connection automatically. The manager acts on it before it becomes a breakdown or a fuel overspend.
Fleet operators in 2026 are shifting from reactive crisis management to incremental, data-driven cost optimisation focused on total cost of ownership. That shift requires a measurement cadence, not just a technology purchase. Effective cost reduction depends on frequent measurement, review, and refinement of operating strategies rather than one-off budget cuts.
Pro Tip: Set a fixed monthly review cadence covering four metrics: cost per kilometre, PM compliance rate, driver behaviour score, and vehicle utilisation rate. Four numbers, reviewed consistently, tell you whether your cost reduction programme is working or drifting.
| Data management approach | Cost visibility | Decision speed | Savings sustainability |
|---|---|---|---|
| Isolated systems per function | Partial, siloed | Slow, manual correlation | Low, one-off gains |
| Integrated platform with unified dashboard | Full, cross-functional | Fast, automated alerts | High, compounding over time |
Key takeaways
Fleet administration cost reduction delivers the greatest results when automation, maintenance compliance, utilisation analysis, driver behaviour monitoring, and integrated data management work together rather than as separate initiatives.
| Point | Details |
|---|---|
| Automate admin workflows first | Manual tasks cost mid-size fleets up to £300,000 annually; automation removes the root cause. |
| Achieve 90%+ PM compliance | Fleets at this level spend 44% less on repairs and suffer 3.5x fewer unplanned breakdowns. |
| Right-size your vehicle count | Up to 20% of fleet vehicles are underutilised; removing idle assets cuts insurance and depreciation immediately. |
| Monitor driver behaviour with data | Aggressive driving raises fuel costs by up to 30%; live scoring enables targeted coaching before costs compound. |
| Review four key metrics monthly | Cost per kilometre, PM compliance, driver scores, and utilisation rate reveal whether savings are holding. |
The cost reduction mistakes I see operators make repeatedly
Fleet cost reduction is rarely about finding one big saving. The operators who struggle are usually the ones looking for it. They run a utilisation review, remove a few vehicles, declare success, and move on. Six months later, costs have crept back up because the underlying workflows were never fixed.
The most damaging pattern I see is treating admin inefficiency as a staffing problem. When billing reconciliation takes too long, the instinct is to hire another administrator. That person absorbs the same broken process and the cost doubles. The workflow is the problem, not the headcount.
I also see operators underestimate how much their driver behaviour data is worth. They install telematics, look at the map view occasionally, and leave the behaviour scoring untouched. That scoring data is a direct line to fuel savings and reduced component wear. Leaving it unreviewed is the equivalent of having a fuel leak and choosing not to investigate.
The operators who achieve consistent, year-on-year cost reduction share one habit: they measure the same things every month without exception. They do not wait for a crisis to prompt a review. They treat their four or five core metrics as non-negotiable management information, the same way they treat their P&L. That discipline, more than any single technology purchase, is what separates fleets that control their costs from those that are controlled by them.
— Vytautas
How Fleetalyse supports fleet cost reduction in practice
Reducing fleet administration costs requires the right data at the right time, and that is precisely what Fleetalyse delivers. The platform combines GPS fleet tracking, automated tachograph downloads, driver behaviour monitoring, and compliance alerts into a single dashboard built for UK operators.
Fleetalyse automates the manual data capture that consumes admin hours, from remote tachograph data retrieval to real-time vehicle location and maintenance scheduling alerts. Fleet managers gain the visibility to act on utilisation gaps, driver performance issues, and compliance risks before they become costs. For HGV operators, the platform’s tachograph and tracking solutions are built around DVSA compliance requirements, removing the guesswork from operator licence management. UK-based support means you get practical help from people who understand the regulatory environment you work in.
FAQ
What is fleet administration cost reduction?
Fleet administration cost reduction is the process of eliminating preventable expenses in fleet operations through workflow automation, data integration, and optimised asset management. It targets both visible costs, such as fuel and repairs, and hidden costs, such as admin labour and compliance rework.
How much can automation save a mid-size fleet annually?
Mid-size fleets can lose between £150,000 and £300,000 annually on preventable admin costs. Automating manual workflows, such as fuel reconciliation and compliance document handling, directly reduces this figure.
What is the fastest way to reduce fleet running costs?
Achieving 90%+ preventive maintenance compliance is the fastest structural saving, cutting repair costs by 44% and reducing unplanned breakdowns by 3.5 times. Pairing this with driver behaviour coaching addresses fuel waste, which represents approximately 35% of total fleet expenditure.
How do I identify underutilised vehicles in my fleet?
Pull 90 days of utilisation data for every vehicle, recording days in use, mileage, and idle time. Vehicles consistently in the bottom band of utilisation are candidates for redeployment or disposal, typically representing 15%–20% of a standard fleet.
Does Fleetalyse support DVSA compliance requirements?
Fleetalyse is built around UK transport regulations, including DVSA requirements and Operator Licence obligations. Its automated tachograph downloads and driver hours monitoring reduce the manual compliance workload for HGV and mixed-fleet operators.