

Fleet ROI explained: a practical guide for UK operators

Fleet ROI is defined as the net financial benefit your fleet generates relative to its total management cost, expressed as a percentage return on investment. For UK fleet operators and logistics managers, understanding fleet ROI is the difference between justifying a telematics investment to your finance director and guessing at its value. The standard formula, ((Total Savings – Total Costs) / Total Costs) x 100, applies across every fleet type, from a ten-van delivery operation to a mixed HGV and trailer fleet. A realistic 3-year ROI for commercial fleets sits between 200% and 400%. Anything above 500% signals overoptimism in your assumptions.
What is the formula for calculating fleet ROI?
Fleet ROI is calculated using one formula: ((Total Savings – Total Costs) / Total Costs) x 100. The result tells you how many pence of net benefit you receive for every pound invested. A result of 250% means you recovered your investment and generated 2.5 times its value in savings.
Costs to include
Getting the cost side right is where most calculations go wrong. Operators frequently undercount by including only subscription fees and hardware, then wonder why actual returns fall short of projections. Hidden costs such as professional upfitting, installation downtime, and internal labour hours must be included alongside subscription and hardware fees.
A complete cost inventory covers:
- Hardware purchase (GPS units, tachograph head units, dashcams, connection harnesses)
- Installation costs, including any vehicle downtime during fitting
- Monthly or annual platform subscription fees
- Internal labour hours for platform management and driver training
- Integration costs if connecting to existing fuel management or maintenance systems
Savings to include
The savings side is equally multi-layered. Fleet management ROI arises from five primary categories: fuel reduction, maintenance savings, labour efficiency, utilisation improvements, and risk reduction. Each category must be quantified against your pre-implementation baseline, not estimated from industry averages alone.
Pro Tip: Before deploying any telematics system, record three months of baseline data covering fuel spend, maintenance invoices, overtime costs, and incident frequency. Without this baseline, your ROI calculation is an opinion, not a measurement.
Example calculation
A fleet of 30 vans spends £180,000 per year on fuel, £40,000 on maintenance, and £30,000 on coordinator labour. After deploying telematics, fuel drops by 12%, maintenance by 20%, and coordinator time reduces by 35%. Annual savings total approximately £39,600. If total first-year costs (hardware, installation, subscription, training) are £18,000, the ROI is ((£39,600 – £18,000) / £18,000) x 100 = 120%. That is a strong first-year result, with compounding benefits in years two and three.
What operational factors most impact fleet ROI?
Fuel is the single largest lever. Fuel typically represents 25–40% of fleet costs, making it the highest-value target for any ROI improvement programme. Route optimisation and driver behaviour monitoring together deliver fuel consumption reductions of 10–15% on average. That is a material saving on any fleet spending over £100,000 per year on diesel or AdBlue.

Maintenance is the second major driver. Predictive maintenance, enabled by telematics data, reduces unplanned downtime by up to 30%. Unplanned downtime costs far more than a scheduled service: you pay for recovery, lost delivery capacity, and often expedited parts. Keeping vehicles on the road through data-led scheduling is one of the clearest ROI wins available to UK logistics operators.
The table below summarises the key ROI drivers and their typical impact ranges:
| ROI driver | Typical impact | Mechanism |
|---|---|---|
| Fuel reduction | 10–15% saving | Route optimisation, driver behaviour monitoring |
| Maintenance cost per mile | 15–25% reduction | Predictive scheduling, fault alerts |
| Administrative labour | £15,000–£25,000 per coordinator annually | Automated reporting, reduced manual data entry |
| Insurance premiums | Reduction varies by insurer | Telematics evidence of safe driving |
| Fleet utilisation | Improved asset deployment | Real-time location and availability data |
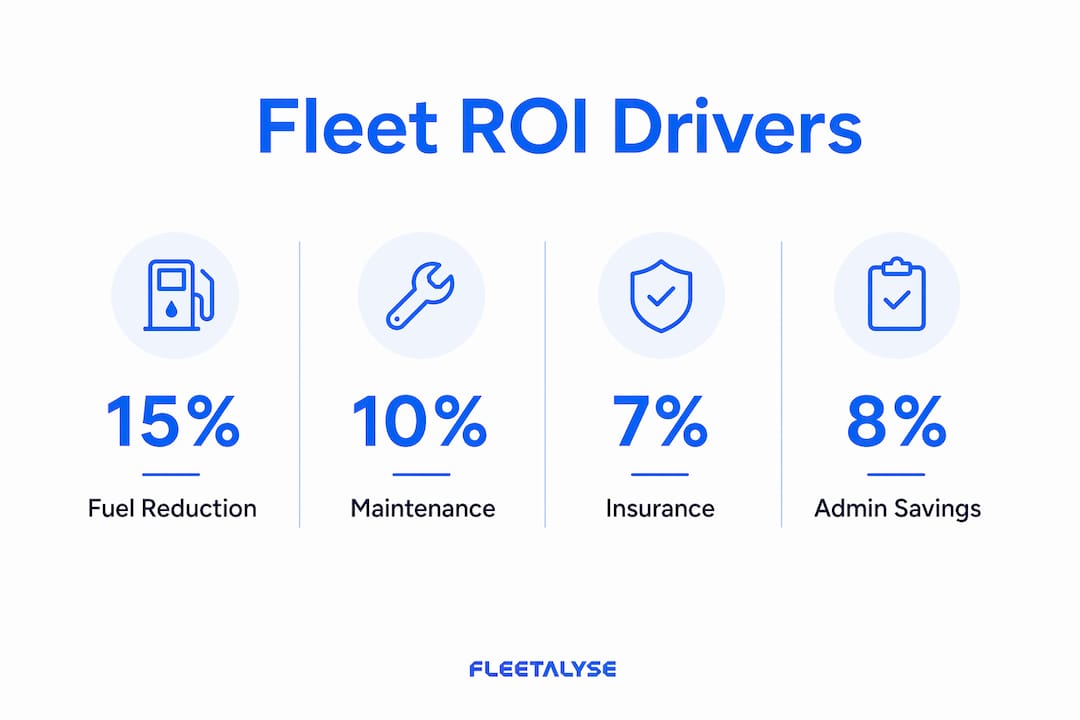
Insurance is an underappreciated ROI contributor. Telematics data provides documented evidence of driver behaviour, which many UK insurers recognise with premium discounts. The saving varies by insurer and fleet profile, but the principle is consistent: lower risk, lower premium.
Administrative labour savings are often the most surprising finding for operators new to telematics. Administrative efficiencies free 30–50% of fleet coordinator time, translating to £15,000–£25,000 in annual value per coordinator. That is time redirected from manual tachograph downloads and spreadsheet maintenance to higher-value operational tasks.
Pro Tip: Efficient route planning practices compound fuel savings over time. A 12% fuel reduction in year one often improves further as drivers adapt their behaviour and route data matures.
How can fleet managers measure and track ROI over time?
Measuring fleet ROI is not a one-time exercise. It is a layered process that unfolds across different time horizons, each revealing a different category of benefit.
- Short-term (months 1–3): Fuel savings and reduced overtime appear first. These are the quickest wins and the easiest to quantify against your baseline data.
- Medium-term (months 4–12): Maintenance benefits emerge as predictive scheduling prevents failures. Insurance renewal discussions become data-led rather than negotiation-based.
- Longer-term (year 2 onwards): Utilisation improvements, driver retention effects, and residual vehicle values become measurable. The industry shift toward managing asset equity means remarketing value is now as critical as daily operational costs in a complete ROI picture.
The payback period is the most effective internal communication metric. Telematics deployments typically achieve payback within 9–18 months. Any deployment exceeding 24 months for payback warrants a scope review. Finance directors understand payback period intuitively, which makes it a powerful tool for securing budget approval.
Sensitivity analysis strengthens your business case. Present three scenarios: low (conservative savings, higher costs), expected (mid-range assumptions), and high (optimistic savings, lower costs). Using ranges rather than single-point assumptions builds credibility with finance stakeholders and protects you when early results are slower than projected.
Common pitfalls to avoid include ignoring residual vehicle value, omitting internal labour from the cost side, and failing to account for fuelling downtime costs that compound across a large fleet. Treat your ROI model as a living document, updated quarterly as real operational data replaces assumptions.
Pro Tip: Maintain a separate ROI tracking spreadsheet independent of your telematics platform’s built-in reporting. Platform dashboards show operational metrics; your spreadsheet connects those metrics to actual pound values from your accounts.
What best practices maximise fleet ROI in UK logistics?
The biggest single predictor of whether telematics investment delivers its projected ROI is not the technology. It is whether management processes change to use the data. Without connecting telematics data to profit and loss impact, ROI is unlikely to meet projections. The platform is the tool; the process change is the return.
Practices that consistently improve fleet ROI outcomes include:
- Driver engagement: Drivers who understand why telematics is deployed, and who receive regular feedback on their scores, reduce fuel consumption and incident rates faster than those who view monitoring as surveillance.
- System integration: Connecting telematics with fuel management, maintenance scheduling, and DVSA compliance records eliminates duplicate data entry and surfaces cross-system insights that isolated platforms cannot provide.
- Conservative assumptions: Most fleet managers are overly optimistic about immediate ROI during early adoption. Training overhead and adoption delays are real. Build them into your model from the start.
- Regular model reviews: Update your ROI assumptions every quarter for the first year. Real data will differ from projections, and your model should reflect that.
- Stakeholder involvement: Include finance, operations, and HR in ROI discussions. Fleet ROI touches payroll (overtime), procurement (fuel and parts), and people management (driver retention). Siloing the analysis in the fleet department limits its credibility.
Beyond the financial metrics, fleet ROI in 2026 increasingly encompasses ESG compliance, driver wellbeing, and customer satisfaction. UK logistics operators facing pressure on carbon reporting find that telematics data supports both ROI calculations and sustainability disclosures. These strategic benefits do not appear in a standard ROI formula, but they influence contract retention and brand reputation in ways that compound over time.
Pro Tip: When presenting fleet ROI to senior leadership, lead with payback period and year-one savings. Save the 3-year ROI percentage for the appendix. Finance teams trust near-term numbers more than multi-year projections.
Key takeaways
Fleet ROI is a compound metric spanning fuel, maintenance, labour, utilisation, and risk, and it requires baseline data, layered measurement, and regular model updates to deliver credible results.
| Point | Details |
|---|---|
| Use the standard formula | Apply ((Total Savings – Total Costs) / Total Costs) x 100 and include all hidden costs. |
| Fuel is the largest lever | Route optimisation and driver monitoring typically cut fuel use by 10–15%. |
| Payback period communicates value | Most telematics deployments pay back within 9–18 months; beyond 24 months, review scope. |
| Use sensitivity analysis | Present low, expected, and high scenarios to build credibility with finance stakeholders. |
| Process change drives returns | Technology alone does not deliver ROI; connecting data to P&L impact is what generates savings. |
Why fleet ROI is more than a spreadsheet exercise
Fleet managers often ask me whether a single ROI number is enough to justify a telematics investment. My honest answer is no. A single percentage figure hides more than it reveals. What actually matters is understanding which streams are driving the return and which are underperforming against your original assumptions.
I have seen operators report impressive headline ROI figures while quietly absorbing significant overtime costs that were never included in the calculation. The number looked good; the P&L told a different story. That gap exists because ROI models are often built once, at the point of purchase, and never updated. Real fleet ROI is a living metric that changes as your operation changes.
The other thing I would push back on is the idea that ROI is purely a financial conversation. In the UK logistics sector right now, the operators who are winning contracts are those who can demonstrate safe driver behaviour, carbon efficiency, and DVSA compliance. None of those appear directly in a standard ROI formula. But they influence revenue, insurance costs, and operator licence security in ways that dwarf a 12% fuel saving. Treat fleet ROI as a starting point for a broader conversation about operational health, not as the final word on whether your investment was worthwhile.
— Vytautas
How Fleetalyse supports your fleet ROI goals
Fleetalyse is built for UK fleet operators who need more than dots on a map. The platform connects GPS tracking, driver behaviour monitoring, tachograph compliance, and fuel consumption insights into a single view, giving you the data needed to calculate and track fleet ROI accurately across every cost and saving category.
The Teltonika FMC650 4G HGV GPS tracker integrates directly with the Fleetalyse platform, providing real-time vehicle data that feeds directly into fuel, maintenance, and utilisation metrics. For mixed fleets, the full range of Fleetalyse tracking solutions covers HGVs, vans, trailers, and assets, with plug-and-play hardware that avoids costly installation downtime. UK-based support means your team gets answers from people who understand DVSA regulations and Operator Licence requirements, not a generic helpdesk.
FAQ
What is fleet ROI and how is it calculated?
Fleet ROI is the net financial benefit of fleet management relative to its total cost, expressed as a percentage using the formula ((Total Savings – Total Costs) / Total Costs) x 100. Savings include fuel, maintenance, labour, and insurance reductions; costs include hardware, subscriptions, installation, and internal labour.
How long does it take for telematics to pay back its investment?
Most telematics deployments achieve payback within 9–18 months. Deployments exceeding 24 months for payback indicate the scope or assumptions need reviewing.
What is a realistic fleet ROI percentage over three years?
A realistic 3-year ROI for commercial fleets ranges from 200% to 400%. Results below 150% suggest assumptions need refining; results above 500% suggest overoptimism in the savings estimates.
Why do fleet ROI calculations often fall short of projections?
ROI shortfalls most commonly occur when hidden costs such as internal labour and installation downtime are excluded, or when savings projections are too optimistic during early adoption. Training delays and process change timelines reduce near-term returns.
Does GPS tracking alone deliver fleet ROI?
GPS tracking contributes to ROI through fuel savings, reduced unauthorised use, and insurance discounts, but the full return depends on connecting tracking data to operational process changes. Technology without management action rarely delivers projected results.