

Vehicle depreciation for UK fleets: a 2026 guide

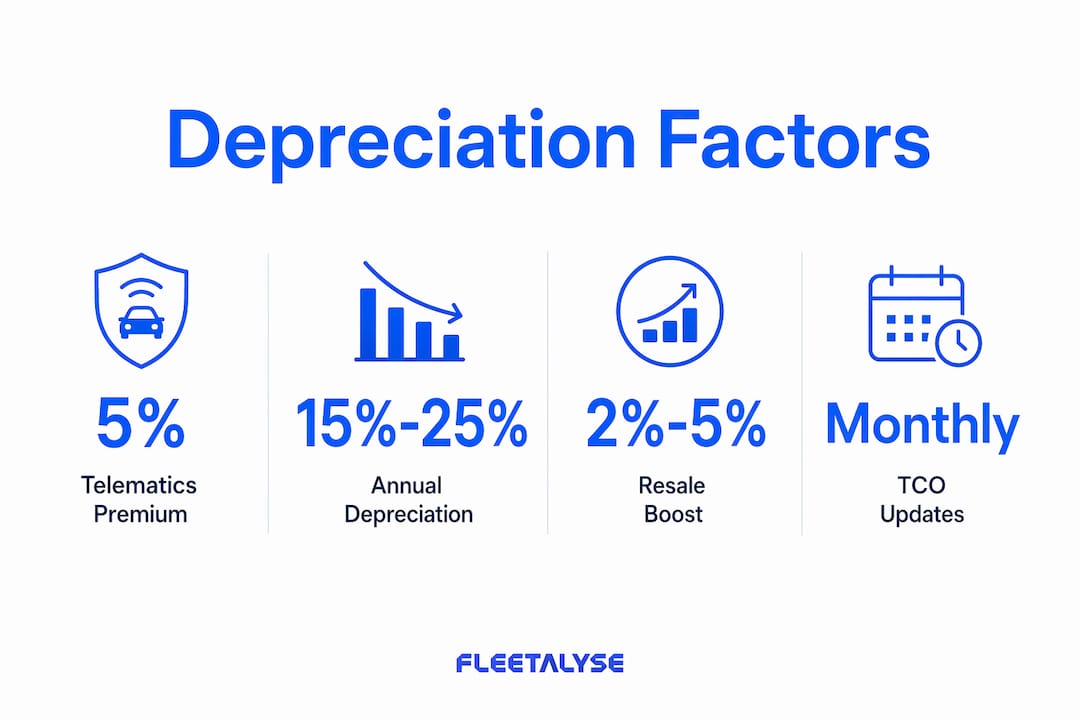
Vehicle depreciation is defined as the reduction in a commercial vehicle’s monetary value over time, and for UK fleet operators it represents the largest single operational cost, typically exceeding both fuel and maintenance combined. Fleet vehicles commonly lose between 15% and 25% of their value annually in their early years. That rate makes depreciation a financial force that demands active management, not passive acceptance. Understanding vehicle depreciation fleet explained in full means knowing how to calculate it, what drives it, and how to use that knowledge to protect your balance sheet.
How is vehicle depreciation calculated for fleets?
Accurate depreciation calculation starts with the correct cost basis. Fleet managers often undervalue assets by calculating depreciation only on the purchase price, ignoring taxes, delivery charges, and upfitting costs. The correct approach uses the Upfit-Adjusted Basis, which aggregates the chassis price, VAT, delivery fees, and all permanent modifications such as racking, refrigeration units, or specialist bodywork. Getting this figure right prevents asset undervaluation on your balance sheet.
Two primary methods apply to fleet vehicle depreciation:
-
Straight-line depreciation spreads the cost evenly across the asset’s useful life. Divide the Upfit-Adjusted Basis minus the estimated residual value by the number of years in service. A van purchased for £30,000 with a £5,000 residual value and a five-year life depreciates at £5,000 per year. This method suits financial reporting and budget forecasting because it produces predictable, consistent figures.
-
Declining balance depreciation applies a fixed percentage to the remaining book value each year. This front-loads the cost, reflecting the reality that vehicles lose value fastest in their first two to three years. It produces higher depreciation charges early in the lifecycle and lower charges later, which can align more closely with actual market value loss.
For tax purposes, UK fleet operators use HMRC’s capital allowances framework rather than MACRS, which is a US tax mechanism. The Annual Investment Allowance (AIA) and Writing Down Allowances (WDAs) govern how vehicle costs are deducted against taxable profits. The applicable rate depends on the vehicle’s CO2 emissions, with lower-emission vehicles qualifying for more favourable treatment.
Pro Tip: Record every upfitting cost at acquisition, including installation labour, so your Upfit-Adjusted Basis is accurate from day one. Errors here compound over the entire depreciation schedule.

What factors influence fleet vehicle depreciation rates?
Depreciation does not follow a straight line in the real world. Several operational and market factors accelerate or slow fleet vehicle value loss, and understanding them gives you control over outcomes.
-
Vehicle age. The steepest value loss occurs in years one through three. After that, the curve flattens. However, maintenance costs escalate sharply for vehicles over ten years old, reaching significantly higher per-mile costs compared to vehicles aged six to ten years. Holding ageing assets too long trades a slower depreciation rate for a punishing maintenance bill.
-
Mileage and utilisation. High annual mileage accelerates mechanical wear and reduces residual value at auction. Buyers discount heavily for odometer readings that exceed sector norms for the vehicle’s age.
-
Vehicle condition. Stains, odour, branding residue, and visible wear all reduce auction prices. Professional fleet detailing preserves exterior and interior condition, reducing the value gap between a well-maintained vehicle and a neglected one. Scheduled detailing also lowers lease return penalties.
-
Telematics and health data. Vehicles with verifiable operational health records achieve 2%–5% higher resale values at auction. Buyers pay a premium for transparency because it reduces their uncertainty about hidden mechanical issues.
-
Powertrain type. Electric vehicles (EVs) follow a different depreciation curve to internal combustion engine (ICE) vehicles. Battery degradation, charging infrastructure concerns, and rapid technology change currently create greater residual value uncertainty for EVs in the commercial sector.
The table below summarises how key factors shift depreciation outcomes:
| Factor | Effect on residual value |
|---|---|
| Verified telematics health data | Up to 5% resale premium |
| Scheduled professional detailing | Reduces condition-related deductions |
| Mileage above sector norm | Significant auction discount |
| Age over ten years | Maintenance costs outpace depreciation savings |
| Missing service history | Buyer uncertainty, lower bids |
Pro Tip: Factory-installed telematics that produce a health certificate at disposal are becoming a market standard. If your vehicles lack this, aftermarket telematics units provide the same documented history that commands higher prices.
How does depreciation affect fleet financial planning?
Depreciation is a fixed, predictable cost. That distinguishes it from variable costs like fuel and reactive maintenance, which fluctuate with usage and events. Because it is predictable, depreciation integrates cleanly into TCO models, allowing fleet managers to calculate the true cost of each vehicle per mile, per day, or per contract period.
The problem is that depreciation rarely appears as a line item in daily operational reports. It does not trigger a purchase order or generate an invoice. This invisibility means it is frequently underestimated by fleet managers who focus on visible costs. The result is a silent drag on profitability that only becomes apparent when vehicles are disposed of and residual values disappoint.
Replacement strategy is where depreciation management has the most direct financial impact. Age-based replacement policies are too blunt. A vehicle replaced at five years regardless of condition or cost profile may be retired too early or too late. Cost-based replacement, triggered when the combined total of depreciation and rising maintenance crosses a defined threshold, produces better lifecycle value. This approach requires real-time TCO data, not annual spreadsheet reviews.
The lease versus purchase decision also turns on depreciation. Leasing transfers residual value risk to the finance provider, which suits operators who want cost certainty. Outright purchase retains that risk but allows operators to benefit from vehicles that hold value better than expected, particularly where condition management and telematics documentation are strong. A fleet maintenance programme that keeps vehicles in top condition throughout their lifecycle directly supports the case for ownership over leasing.
Pro Tip: Build a TCO model that updates monthly with actual maintenance spend, fuel costs, and mileage. When the combined cost per mile exceeds your replacement threshold, the data tells you to act. Waiting for an annual review means you are always reacting late.
What practical steps can fleet managers take to control depreciation?
Controlling fleet vehicle value loss requires deliberate action across three areas: data capture, condition management, and remarketing preparation.
-
Capture connected vehicle data continuously. Telematics systems that record engine health, mileage, fault codes, and driver behaviour create a documented operational history. This history is the single most valuable asset at disposal. Connected vehicle data increasingly determines resale value by surpassing traditional inspection-only assessments.
-
Schedule regular detailing as a maintenance task. Treat vehicle condition as a managed asset, not an afterthought. Assign detailing intervals in your maintenance schedule alongside oil changes and tyre rotations. Vehicles presented at auction in clean, unmarked condition avoid the steep deductions that buyers apply to visible wear.
-
Prepare vehicles for remarketing before they go to auction. Proactive remarketing means removing branding residue, repairing minor defects, and presenting a complete service history. Vehicles that arrive at auction with unresolved condition issues receive lower bids because buyers price in the cost and risk of remediation.
-
Align acquisition planning with disposal cycles. Buying vehicles with factory telematics and specifying upfitting that adds genuine utility without adding unrecoverable cost protects the Upfit-Adjusted Basis. Plan disposal timing to coincide with market demand peaks rather than defaulting to fixed calendar dates.
-
Use telematics documentation as a remarketing tool. A complete vehicle health record from a platform like Fleetalyse reduces buyer uncertainty and supports higher auction bids. Fleet managers who present this data proactively position their vehicles above the average lot.
A vehicle maintenance and repair guide that covers scheduled servicing, fluid management, and pre-disposal inspections gives fleet managers a practical framework for condition control across the full lifecycle.
Pro Tip: Register your telematics units as early as possible in each vehicle’s life. The longer the documented health history, the stronger the case for a premium price at disposal.
Key takeaways
Depreciation is the largest fixed cost in fleet operations, and managing it actively through accurate calculation, condition control, and data-driven replacement decisions directly protects profitability and residual value.
| Point | Details |
|---|---|
| Use the Upfit-Adjusted Basis | Include purchase price, taxes, delivery, and all upfitting costs for accurate depreciation figures. |
| Integrate depreciation into TCO models | Combine fixed depreciation with variable maintenance and fuel costs for real-time replacement decisions. |
| Telematics data commands a resale premium | Vehicles with verified health records achieve up to 5% higher auction values. |
| Condition management reduces value loss | Scheduled detailing and pre-auction preparation prevent steep buyer deductions. |
| Replace on cost thresholds, not age | Cost-based triggers outperform fixed age policies for lifecycle value optimisation. |
Depreciation is the cost most fleet managers are not watching closely enough
Fleet managers I speak with routinely track fuel spend to the penny and scrutinise maintenance invoices line by line. Depreciation gets a fraction of that attention, usually because it does not appear in the weekly cost report. That is a structural blind spot, and it costs real money.
The vehicles that lose the most value are not necessarily the oldest or the highest-mileage. They are the ones with no documented history, poor condition at disposal, and no proactive remarketing effort. I have seen well-maintained vehicles with full telematics records outperform newer vehicles at auction purely because the buyer had confidence in what they were purchasing.
The other mistake I see repeatedly is holding vehicles past the point where maintenance costs have already eroded the benefit of a lower depreciation charge. The maths are straightforward once you have a TCO model in place. The difficulty is building the discipline to act on the data rather than defaulting to “we’ll replace it next year.”
My recommendation is to treat depreciation as a live financial metric, not an accounting entry. Build it into your monthly cost reporting, connect it to your telematics data, and set replacement triggers based on combined cost thresholds. The fleet operators who do this consistently protect their margins and avoid the double hit of a maintenance spike followed by a disappointing resale.
— Vytautas
How Fleetalyse supports fleet depreciation management
Fleet depreciation management depends on the quality of data you collect throughout each vehicle’s life. Fleetalyse provides the telematics infrastructure that makes that data collection automatic and continuous.
The Teltonika FMC650 GPS tracker integrates with the Fleetalyse platform to deliver real-time vehicle health monitoring, mileage tracking, and driver behaviour data for HGVs and commercial vehicles. That operational record becomes your most persuasive remarketing asset at disposal. Fleetalyse also supports maintenance scheduling and fuel consumption analysis, feeding directly into the TCO models that drive cost-based replacement decisions. For fleet managers who want to protect residual values and make replacement decisions on evidence rather than instinct, the Fleetalyse solutions platform provides the visibility to do exactly that.
FAQ
What is vehicle depreciation in a fleet context?
Vehicle depreciation is the reduction in a commercial vehicle’s book and market value over time. For UK fleets, it is typically the largest component of Total Cost of Ownership, often exceeding fuel and maintenance costs.
How do I calculate depreciation on a fleet vehicle?
Start with the Upfit-Adjusted Basis, which includes the purchase price, taxes, delivery, and all permanent modifications. Apply either straight-line or declining balance depreciation over the vehicle’s useful life, and use HMRC capital allowances for tax purposes.
What depreciation rate should I use for fleet vehicles?
UK fleet vehicles typically depreciate at 15%–25% annually in their early years, with the steepest losses occurring in years one through three. The exact rate depends on vehicle type, mileage, condition, and market demand.
Does telematics data affect resale value?
Vehicles with verified telematics health records achieve 2%–5% higher resale values at auction compared to vehicles without documented operational histories. Buyers pay a premium for transparency.
When is the right time to replace a fleet vehicle?
Replace vehicles when the combined total of depreciation and maintenance costs crosses your defined cost-per-mile threshold, not at a fixed age. Cost-based replacement consistently outperforms age-based policies for lifecycle value.