


What is fleet carbon footprint: a guide for operators

A fleet carbon footprint is the total greenhouse gas emissions generated directly and indirectly by all vehicles and operations within a fleet, measured in carbon dioxide equivalents (CO₂e). The industry standard term is “fleet GHG emissions,” and both phrases refer to the same measurement framework. Understanding what is fleet carbon footprint means understanding three distinct emission scopes, each carrying different measurement challenges and reduction opportunities. For fleet operators, transport managers, and environmental compliance officers, this is not an abstract environmental concept. It is a measurable liability that affects fuel costs, regulatory standing, and contract eligibility with major shippers who now require ESG reporting from their logistics partners.
What emission sources contribute to a fleet’s carbon footprint?
Fleet GHG emissions fall into three scopes defined by the Greenhouse Gas Protocol, the globally recognised standard for corporate emissions accounting.
Scope 1 covers direct emissions from fuel combustion in your own vehicles. Every litre of diesel or petrol burned produces a calculable quantity of CO₂, methane, and nitrous oxide. This is the most straightforward scope to measure because fuel purchase records provide the primary data source.
Scope 2 covers indirect emissions from electricity used to charge battery electric vehicles (BEVs). The emissions figure is not fixed. It varies depending on the carbon intensity of the electricity grid at the time of charging. A fleet charging overnight from a grid powered largely by renewables produces far lower Scope 2 emissions than one charging during peak hours from fossil-fuel-heavy generation.
Scope 3 is where the complexity lies. Scope 3 emissions, including manufacturing, fuel production, and supply chain effects, often represent up to 70% of a fleet’s total carbon footprint. That figure surprises most operators who focus exclusively on tailpipe output. Scope 3 includes:
- Vehicle manufacturing and end-of-life disposal
- Upstream fuel production and refining
- Maintenance parts and consumables supply chains
- Business travel and employee commuting linked to fleet operations
- Third-party haulage contracted on your behalf
Ignoring Scope 3 produces a carbon footprint figure that is structurally incomplete. Regulators and major clients increasingly require full-scope reporting, so the gap between what you measure and what you actually emit becomes a compliance and reputational risk.
How is a fleet carbon footprint calculated and reported?
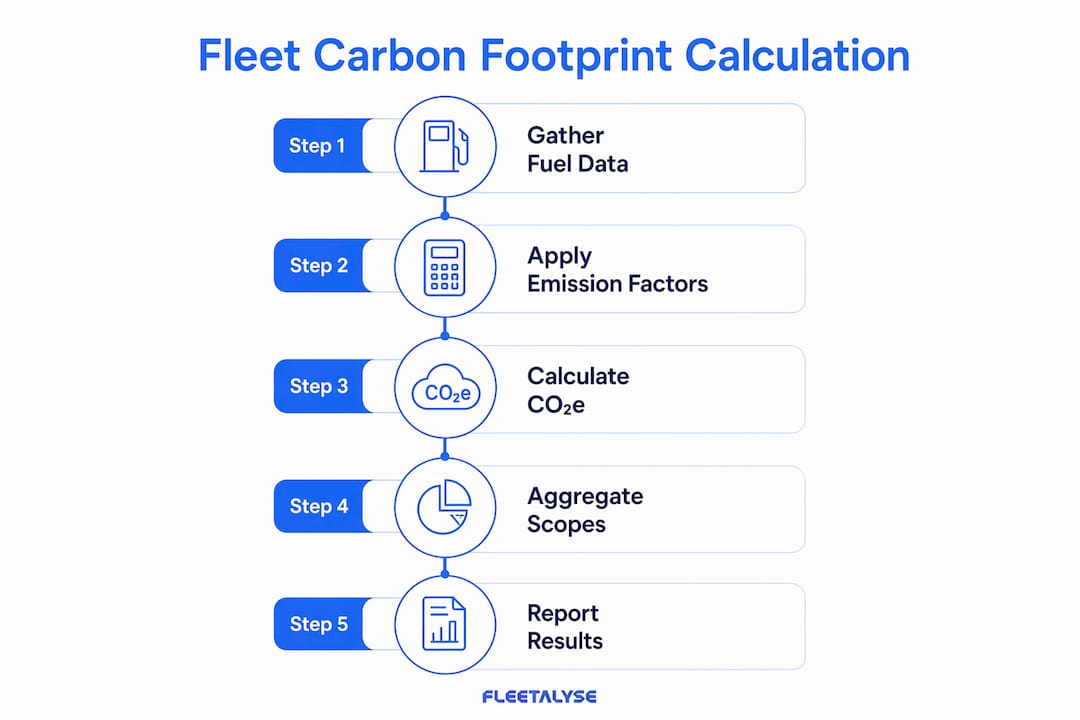
The core calculation is straightforward: fuel consumption multiplied by an emission factor equals CO₂ emissions. The complexity lies in sourcing accurate inputs and applying the correct emission factors for each fuel type and region.
The UK Government publishes annual emission conversion factors through the Department for Energy Security and Net Zero. These factors differ by fuel type and are updated each year to reflect changes in grid carbon intensity and fuel composition. The table below shows representative emission factors for common fleet fuels.
| Fuel type | Emission factor (kg CO₂e per litre or kWh) | Notes |
|---|---|---|
| Diesel | 2.51 kg CO₂e / litre | Standard UK figure; includes well-to-tank |
| Petrol | 2.31 kg CO₂e / litre | Standard UK figure |
| LPG | 1.51 kg CO₂e / litre | Lower carbon intensity than diesel |
| UK grid electricity | 0.207 kg CO₂e / kWh | 2024 UK average; varies by time of day |
To calculate your fleet’s annual Scope 1 footprint, multiply total litres consumed across all vehicles by the relevant emission factor. A 100-vehicle diesel fleet averaging 12,000 miles per year generates approximately 1,200 metric tonnes of CO₂ annually, equivalent to the emissions of 260 passenger cars. That scale illustrates why fleet emissions are a material business issue, not a peripheral sustainability concern.
Data sources you need for accurate carbon footprint measurement include fuel card records, telematics mileage data, vehicle type and engine specification, and energy bills for any depot charging infrastructure. Telematics platforms that capture real-time fuel consumption and mileage data remove the manual aggregation step and reduce reporting error significantly.
Pro Tip: Register your vehicles on a telematics platform before your reporting period begins. Retrospective data collection from fuel cards alone misses idle fuel burn, which can account for a meaningful share of total consumption.
Reporting frameworks used by UK fleet operators include the Greenhouse Gas Protocol Corporate Standard, ISO 14064, and the UK Government’s Streamlined Energy and Carbon Reporting (SECR) requirements, which apply to large companies. Smaller operators increasingly report voluntarily to meet client tender requirements.
What strategies can reduce fleet carbon emissions effectively?
Reducing fleet carbon emissions does not require a single large capital project. Carbon reduction spans operational efficiency, fuel strategy, and driver behaviour, and measurable cuts are achievable within 90 days with payback within six months for many interventions.
-
Route optimisation. AI-driven route optimisation can cut total vehicle miles by 8–15%, directly lowering fuel consumption and emissions. Fewer miles driven means fewer litres burned, with no change to the vehicle fleet required.
-
Idle reduction. A single truck idling for two hours daily wastes roughly 1,500 gallons of fuel annually. Multiply that across a fleet of 50 HGVs and the fuel cost and emissions impact becomes a primary target for reduction. Idle monitoring through telematics is one of the most cost-effective interventions available.
-
Preventive maintenance. Under-inflated tyres, dirty air filters, and poorly calibrated fuel injectors all increase fuel consumption. A structured maintenance schedule keeps each vehicle operating at its designed efficiency.
-
Driver behaviour coaching. Harsh acceleration, late braking, and excessive speed increase fuel consumption measurably. Telematics-based driver scoring identifies the highest-impact drivers and enables targeted coaching rather than blanket training programmes.
-
EV transition planning. Battery electric vehicles can reduce well-to-wheel greenhouse gas emissions by approximately 75% compared to diesel heavy-duty trucks. The transition requires a duty-cycle assessment first. A vehicle that regularly exceeds 300 miles per shift on motorways has different electrification requirements than a local delivery van covering 80 miles daily.
-
Alternative fuels as a bridge. Hydrotreated Vegetable Oil (HVO) is a drop-in replacement for diesel that reduces lifecycle CO₂ emissions by up to 90% without engine modification. It suits fleets that cannot yet electrify their heaviest assets.
Operational improvements such as route optimisation, idle reduction, and preventive maintenance typically cost £40–£120 per vehicle but yield 15–25% emissions reductions. A 20% emission cut typically saves £60,000–£120,000 annually per 100 vehicles. The financial case for reducing fleet carbon emissions is as strong as the environmental one.
Pro Tip: Prioritise idle reduction and route optimisation before committing capital to new vehicles. Both deliver measurable results within weeks and generate the data you need to build a credible EV business case.
What challenges affect fleet carbon footprint management?
Fleet carbon footprint management carries several complexities that operators frequently underestimate.
-
Well-to-wheel versus tailpipe measurement. Tailpipe CO₂ is only part of the picture. Well-to-wheel analysis includes the emissions produced extracting, refining, and transporting the fuel before it reaches your tank. Diesel’s well-to-tank emissions add roughly 20% on top of combustion figures.
-
Grid carbon intensity for EVs. Grid carbon intensity critically influences BEV well-to-wheel emissions. Upstream emissions including electricity generation and battery materials account for 35–38% of total BEV lifecycle impacts. A fleet that charges entirely from renewable energy achieves far greater reductions than one drawing from a carbon-heavy grid.
-
Idling and deferred maintenance. Both inflate actual emissions above what standard mileage-based calculations predict. Fleets that rely solely on fuel card data without telematics often undercount their true footprint.
-
Duty-cycle mismatch. 95% of fleet owners view electric vehicles as the long-term decarbonisation solution, but implementation must be supported by detailed duty-cycle assessment and infrastructure planning. Deploying BEVs on routes they cannot complete without mid-shift charging creates operational disruption that undermines the business case.
-
Reporting accuracy and regulatory compliance. SECR requires large UK companies to report energy use and carbon emissions annually. Errors in fuel data or incorrect emission factors create compliance risk. Automated data collection through telematics removes the manual transcription errors that most commonly cause reporting inaccuracies.
How does carbon footprint data integrate into fleet management?
Carbon footprint measurement becomes most valuable when it feeds directly into operational decision-making rather than sitting in an annual sustainability report.
Telematics platforms that capture real-time fuel consumption, mileage, idle time, and route data give fleet managers a live view of emissions performance. That data supports procurement decisions by revealing which vehicle models consume the most fuel per tonne-kilometre, informing replacement cycles. It also supports driver management by identifying behaviour patterns that drive excess consumption.
Fleet decarbonisation is a strategic shift for competitiveness and long-term operational resilience, not just environmental compliance. Operators who integrate carbon data into their fleet management practice gain a cleaner picture of true operating costs, because fuel and emissions are directly linked. Reducing one reduces the other.
Key integration points include:
- Linking telematics fuel data to your carbon reporting framework for automated monthly reporting
- Setting per-vehicle emissions targets and tracking performance through your fleet management platform
- Using emissions data to support Operator Licence renewal and DVSA compliance documentation
- Reporting Scope 1 and Scope 2 figures to clients who require ESG data in tender submissions
Pro Tip: Use your GPS tracking platform to export monthly fuel and mileage reports in a format that maps directly to your chosen emission factor table. This removes the manual step that most commonly introduces errors into annual carbon reports.
Key takeaways
Accurate fleet carbon footprint measurement across all three emission scopes is the foundation for reducing costs, meeting regulatory requirements, and winning contracts that demand ESG compliance.
| Point | Details |
|---|---|
| Three scopes define fleet emissions | Scope 1 is direct combustion, Scope 2 is EV charging, and Scope 3 covers supply chain and manufacturing. |
| Scope 3 dominates total footprint | Supply chain and upstream emissions can represent up to 70% of a fleet’s total carbon output. |
| Idle reduction delivers fast returns | A single idling truck wastes roughly 1,500 gallons of fuel annually; telematics-based monitoring fixes this quickly. |
| EV transition requires duty-cycle data | BEVs cut well-to-wheel emissions by approximately 75%, but only when matched to routes they can operationally support. |
| Emission cuts generate direct cost savings | A 20% reduction in fleet emissions typically saves £60,000–£120,000 per year per 100 vehicles. |
Why most operators are measuring the wrong thing
Fleet managers often tell me they have their carbon footprint “under control” because they track fuel spend. Fuel spend and carbon footprint are related, but they are not the same measurement. Fuel spend does not capture idle burn accurately. It does not account for upstream emissions from fuel production. It tells you nothing about Scope 3. And it gives you no basis for comparing the true environmental cost of diesel against HVO or electricity.
The operators I see making real progress are the ones who treat carbon data the same way they treat tachograph data: as a compliance input that also happens to reveal operational inefficiency. When you know exactly which vehicles idle the most, which routes generate the highest emissions per delivery, and which drivers consume 15% more fuel than the fleet average, you have a prioritised list of interventions. That list is worth more than any sustainability pledge.
The other misconception I encounter regularly is that electrification solves everything. It does not, if your electricity comes from a carbon-heavy grid or if you deploy BEVs on routes that require mid-shift charging stops. The well-to-wheel picture matters. Operators who skip the duty-cycle assessment and the grid carbon analysis often find their actual emission reductions fall well short of projections.
Carbon reduction is a framework, not a project. The operators who treat it that way see measurable results within a quarter and sustained savings year on year.
— Vytautas
How Fleetalyse supports fleet carbon footprint tracking
Fleetalyse gives fleet operators the real-time data they need to measure and reduce their carbon footprint without adding administrative burden. The platform captures fuel consumption, idle time, mileage, and route efficiency across HGVs, vans, trailers, and mixed assets, feeding the precise inputs that carbon footprint calculations require.
The Teltonika FMC650 HGV GPS tracker integrates directly with the Fleetalyse platform to deliver live vehicle performance data, including fuel consumption metrics that map directly to UK Government emission factors. For trailer and asset tracking, the asset and trailer GPS range extends visibility across your full fleet. UK-based support means setup is straightforward and data quality is maintained from day one, giving you a carbon reporting foundation that holds up to SECR and client ESG scrutiny.
FAQ
What is a fleet carbon footprint?
A fleet carbon footprint is the total greenhouse gas emissions produced directly and indirectly by all vehicles and operations within a fleet, expressed in CO₂ equivalents (CO₂e). It covers Scope 1 combustion emissions, Scope 2 electricity emissions, and Scope 3 supply chain emissions.
How do I calculate my fleet’s carbon footprint?
Multiply total fuel consumption in litres by the relevant UK Government emission factor for each fuel type. For a diesel fleet, the standard figure is 2.51 kg CO₂e per litre, giving a 100-vehicle fleet roughly 1,200 metric tonnes of CO₂ annually at 12,000 miles per vehicle per year.
What is the biggest source of fleet carbon emissions?
Scope 3 emissions, covering manufacturing, fuel production, and supply chain effects, often represent up to 70% of a fleet’s total carbon footprint, making them the largest single category despite being the hardest to measure directly.
Do electric vehicles eliminate fleet carbon emissions?
No. BEVs reduce well-to-wheel emissions by approximately 75% compared to diesel heavy-duty trucks, but upstream emissions from electricity generation and battery manufacturing account for 35–38% of total lifecycle impacts. Grid carbon intensity determines the actual reduction achieved.
What reporting frameworks apply to UK fleet operators?
Large UK companies must comply with Streamlined Energy and Carbon Reporting (SECR) requirements. The Greenhouse Gas Protocol Corporate Standard and ISO 14064 are the most widely used voluntary frameworks for fleet operators reporting to clients and investors.