

What is vehicle utilisation rate? A practical guide for UK fleets

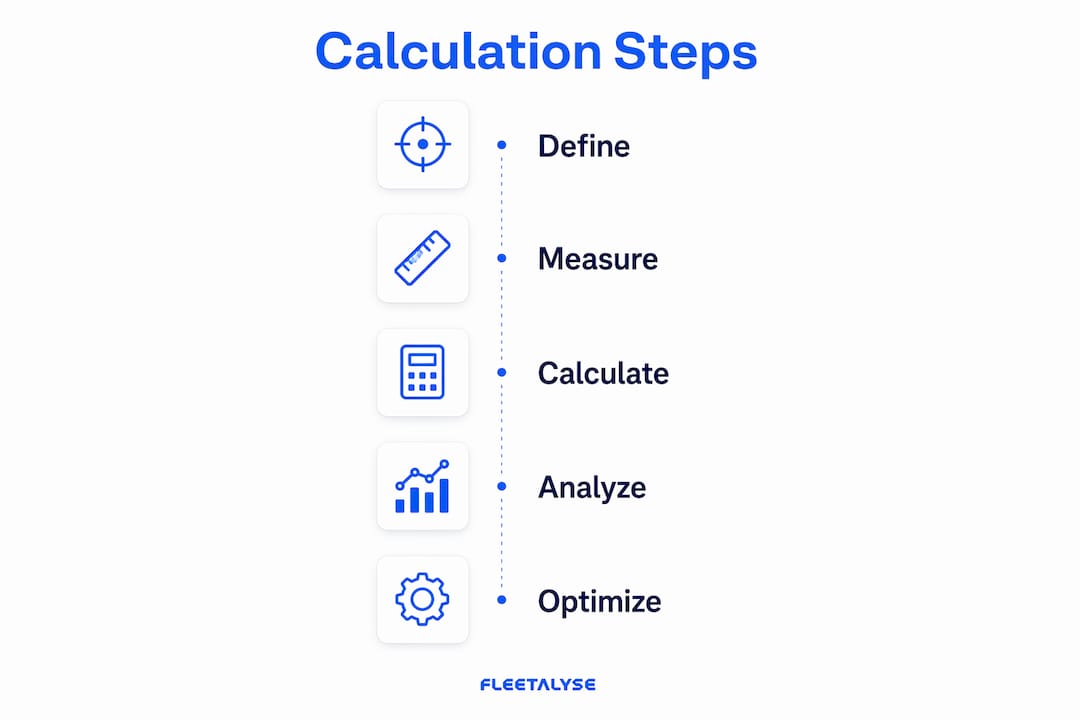
Vehicle utilisation rate is the percentage of a fleet’s available time or vehicle count actively engaged in productive work. It is the single most direct measure of whether your assets are earning their keep or quietly draining your budget. Calculated as (Total Active Hours ÷ Total Available Hours) × 100, it gives fleet managers a clear, comparable figure to act on.
What is vehicle utilisation rate and why does it matter?
Vehicle utilisation rate is a key performance indicator (KPI) that compares how much time your vehicles spend in productive use against the total time they could be working. The result is expressed as a percentage, and it sits at the heart of every serious fleet efficiency conversation.
Three terms often get conflated, but they measure different things:
- Utilisation measures active productive time versus total available time.
- Availability measures whether a vehicle is mechanically ready for service, regardless of whether it is actually deployed.
- Productivity measures output per trip or per driver, such as deliveries completed per hour.
A vehicle can be available 95% of the time yet only utilised 50%. That gap is precisely where hidden costs accumulate. Understanding which metric you are looking at determines whether you diagnose the right problem.
How to calculate vehicle utilisation rate
Two primary methods give you different but complementary views of your fleet’s performance.

Time-based utilisation measures active hours against total available hours:
Vehicle-count utilisation measures how many vehicles are deployed at any given time:
A practical example of time-based calculation: a delivery fleet of 10 vehicles, each available for 22 hours across a working period, has 220 total available hours. If those vehicles collectively log 165 utilised hours, the utilisation rate is 75%. For vehicle-count utilisation, if 42 of your 50 vehicles are actively deployed on a given day, your rate is 84%.
Key points to keep in mind when calculating:
- Define your operational window carefully. A 24-hour denominator dilutes true performance for fleets that only operate during business hours.
- Use active operational hours rather than calendar hours to surface genuine inefficiencies.
- Track both methods together. Relying on only one metric creates blind spots that lead to poor fleet-sizing decisions.
Pro Tip: Set your available hours window to match your actual operating shift, not a 24-hour clock. A van that sits in a depot from 6 PM to 6 AM should not count those hours as “available” if your operation never runs overnight.
Why monitoring vehicle utilisation actively pays off
Tracking utilisation rate consistently produces measurable operational and financial benefits. The most direct gain is cost control: vehicles that sit idle still incur insurance, road tax, and maintenance reserve costs whether their wheels turn or not.
Key benefits of active utilisation monitoring:
- Reduced fleet operating costs by identifying assets that can be redeployed or removed from the fleet.
- Better scheduling and route planning, as utilisation data reveals which vehicles are consistently underused and which are overloaded.
- Right-sized fleet capacity, preventing both over-investment in surplus vehicles and under-investment that strains active assets.
- Improved maintenance planning, because utilisation data shows actual wear patterns rather than calendar-based assumptions.
- Stronger compliance management, particularly for operators subject to DVSA regulations and Operator Licence requirements, where accurate driver hours and vehicle activity records are non-negotiable.
Utilisation insights also feed directly into transport management decisions. Operators who align fleet capacity with real demand, rather than historical guesswork, consistently find they can serve the same volume with fewer assets or handle more volume without adding vehicles. For UK operators working with transport management companies, utilisation data is increasingly a prerequisite for capacity planning conversations.
Industry benchmarks: what does a good utilisation rate look like?
Optimal utilisation rates vary by sector. A rate that signals strong performance in one industry can indicate over-strain in another.
| Fleet type | Typical utilisation range | Interpretation |
|---|---|---|
| Delivery and logistics | 70–85% | Strong operational efficiency |
| Construction | 55–70% | Reflects seasonal and site variability |
| Municipal and government | 50–65% | Standby capacity is often intentional |
| Service and repair | 65–80% | Balances response time with deployment |
| Rental | 75–90% | Revenue-driven; high rates are expected |
What the thresholds mean in practice:
- Below 50–60%: Excess capacity or scheduling problems. You are likely paying for assets that generate no return.
- 70–85%: The target zone for most delivery, service, and commercial rental fleets. Assets are well deployed without being strained.
- Above 85–90%: A warning signal in most industries. Vehicles have insufficient downtime for preventive maintenance, and breakdown risk rises.
The most useful benchmark is not an industry average but your own fleet’s historical peak. If your utilisation has dropped without a corresponding fall in demand, that gap warrants investigation regardless of where the absolute figure sits.
The real costs of getting utilisation wrong
Both extremes carry serious operational consequences, and neither is a safe default.
Under-utilisation consequences:
- Capital tied up in idle assets that generate no revenue.
- Insurance, depreciation, and storage costs accumulate on vehicles that rarely move.
- Fleet size becomes misaligned with actual demand, making the operation harder to justify commercially.
Over-utilisation consequences:
- Accelerated wear and higher repair frequency, particularly on HGVs and heavy plant.
- Reduced windows for scheduled preventive maintenance, which increases the likelihood of unplanned breakdowns.
- Driver fatigue risk increases when the same vehicles and drivers absorb disproportionate workloads.
- Rates above 85–90% raise operational risks including inadequate maintenance opportunities and higher long-term costs.
Pro Tip: If your utilisation rate is consistently above 88%, build a maintenance buffer into your scheduling before adding new vehicles. Buying an extra asset is often cheaper than the repair bill from running existing ones into the ground.
Correcting misaligned utilisation starts with accurate data. Reviewing active hours by vehicle, cross-referencing against maintenance records, and comparing deployment patterns across the week will usually reveal whether the problem is scheduling, fleet size, or demand variability.
How Fleetalyse helps UK fleets measure and act on utilisation data
Accurate utilisation measurement depends entirely on the quality of data feeding into your calculations. Fleetalyse is a UK-based telematics platform built specifically for commercial transport operators, and its integrated hardware and software remove the guesswork from utilisation tracking.
Fleetalyse capabilities that directly support utilisation management:
- Real-time GPS tracking showing live vehicle positions and active status across your entire fleet.
- Ignition status monitoring that records precise engine-on and engine-off times, giving you accurate active hours for time-based utilisation calculations.
- Remote tachograph downloads that automate driver hours data capture, removing manual entry errors from your records.
- Driver behaviour analytics that distinguish productive driving time from excessive idling, so your utilisation figures reflect genuine work rather than stationary engine time.
- Automated maintenance scheduling that flags service intervals based on actual mileage and usage, not calendar estimates.
- Mixed fleet support covering HGVs, vans, trailers, and other assets through plug-and-play hardware that does not require professional installation.
Consider a UK haulage operator running 30 HGVs across regional delivery routes. Without telematics, utilisation figures rely on driver logs and manual records, which are prone to gaps. With Fleetalyse’s HGV GPS trackers, every vehicle’s active hours are captured automatically. The operator can see at a glance which vehicles are consistently below target utilisation, identify whether the cause is scheduling, maintenance downtime, or driver availability, and adjust accordingly. UK-based support means setup queries are handled by people who understand DVSA requirements and Operator Licence obligations, not a generic overseas helpdesk.
What factors affect vehicle utilisation rate?
Utilisation does not exist in isolation. Several operational and external variables push the figure up or down, and understanding them helps you diagnose problems rather than simply observe them.
- Scheduling quality: Poor route planning or uneven job allocation leaves some vehicles idle while others are overloaded.
- Maintenance downtime: Vehicles off the road for servicing or repairs reduce available hours and pull the utilisation rate down.
- Seasonal demand: Construction, agriculture, and event logistics fleets see natural utilisation peaks and troughs across the year.
- Driver availability: Shortages or absences mean vehicles sit unused even when demand exists.
- Fleet size relative to demand: An oversized fleet will structurally produce low utilisation regardless of how well it is managed.
- Geographic spread: Fleets covering wide areas may have vehicles positioned far from demand, increasing dead mileage and reducing productive active time.
- Regulatory requirements: Mandatory rest periods, tachograph rules, and DVSA compliance obligations all constrain the hours a vehicle can legally operate.
Matching fleet capacity to service demand is the foundational fix for most utilisation problems. Technology can surface the data, but the underlying cause is almost always a mismatch between how many vehicles you have and how much work is actually available.
Practical techniques to improve vehicle utilisation
Improving utilisation is a combination of better data, better scheduling, and better decisions about fleet size.
Use telematics data as your baseline. You cannot improve what you cannot measure. GPS tracking and ignition monitoring give you the accurate active hours data that manual logs cannot reliably provide.
Segment your fleet by utilisation band. Group vehicles into high, medium, and low utilisation categories. Low-utilisation vehicles are candidates for redeployment, disposal, or reassignment to different routes or depots.

Refine scheduling around real demand patterns. Analyse when and where demand peaks occur across the week and month, then align vehicle deployment to match. Vehicles should not be sitting at a depot during peak demand windows.
Reduce unplanned downtime. Preventive maintenance, scheduled around actual usage data rather than calendar intervals, keeps vehicles available when you need them. Unplanned breakdowns are the fastest way to destroy utilisation figures.
Review fleet size annually. Demand changes. A fleet sized for last year’s contract volumes may be oversized or undersized today. Regular review prevents structural under-utilisation from becoming a permanent cost.
Track both time-based and vehicle-count metrics. Each reveals a different dimension of the problem. Time-based utilisation shows whether active vehicles are being used efficiently; vehicle-count utilisation shows whether you have the right number of assets deployed.
Challenges in measuring and tracking utilisation accurately
Getting a reliable utilisation figure is harder than the formula suggests. Several practical obstacles affect accuracy.
Defining “available” time is the most common source of error. If your denominator includes hours when vehicles are legally or operationally unavailable, such as overnight, weekends, or mandatory rest periods, your utilisation rate will appear artificially low. The fix is to define available hours as your actual operational window, not a 24-hour clock.
Data quality from manual records is unreliable. Driver-reported start and end times are subject to rounding, omission, and honest error. Telematics hardware removes this variable by recording ignition events automatically.
Idle time classification creates distortion. A vehicle with its engine running at a loading bay is technically “on” but not productively utilised. Without granular telematics data, that idle time inflates your active hours figure and overstates true utilisation.
Mixed asset types complicate fleet-wide averages. Combining HGV utilisation data with van or trailer data in a single figure obscures the performance of each asset class. Segment by vehicle type for meaningful analysis.
Inconsistent measurement periods make trend analysis unreliable. Comparing a weekly figure against a monthly average, or a summer period against a winter one without seasonal adjustment, produces misleading conclusions. Standardise your measurement period and stick to it.
Key takeaways
Vehicle utilisation rate is the foundational fleet efficiency metric: calculate it accurately, benchmark it against your sector, and act on both extremes before they become cost problems.
| Point | Details |
|---|---|
| Core formula | Divide total active hours by total available hours, then multiply by 100 to get your utilisation percentage. |
| Optimal range | Most delivery fleets should target 70–85%; service and repair fleets 65–80%; construction 55–70%; and municipal fleets 50–65%. Rates above 85–90% in any sector signal maintenance risk. |
| Two methods needed | Track both time-based and vehicle-count utilisation to avoid blind spots in fleet sizing and scheduling. |
| Operational window matters | Use your actual shift hours as the denominator, not a 24-hour period, for meaningful figures. |
| Telematics removes guesswork | Automated GPS and ignition data from platforms like Fleetalyse replace unreliable manual logs with accurate, actionable records. |
Start measuring utilisation accurately with Fleetalyse
If your utilisation figures rely on driver logs or spreadsheets, you are working with incomplete data. Fleetalyse provides UK fleet operators with the GPS tracking, tachograph integration, and driver behaviour monitoring needed to capture accurate utilisation data automatically, across every vehicle type in your fleet.
The Teltonika FMC650 HGV GPS tracker is a popular starting point for operators running heavy goods vehicles, combining 4G connectivity with the Fleetalyse platform for real-time active hours monitoring and compliance reporting. For mixed fleets including trailers and assets, asset and trailer GPS trackers extend the same visibility to every unit in your operation.
UK-based support, plug-and-play installation, and DVSA-aligned compliance tools make Fleetalyse a practical choice for operators who need accurate utilisation data without a lengthy implementation project.