
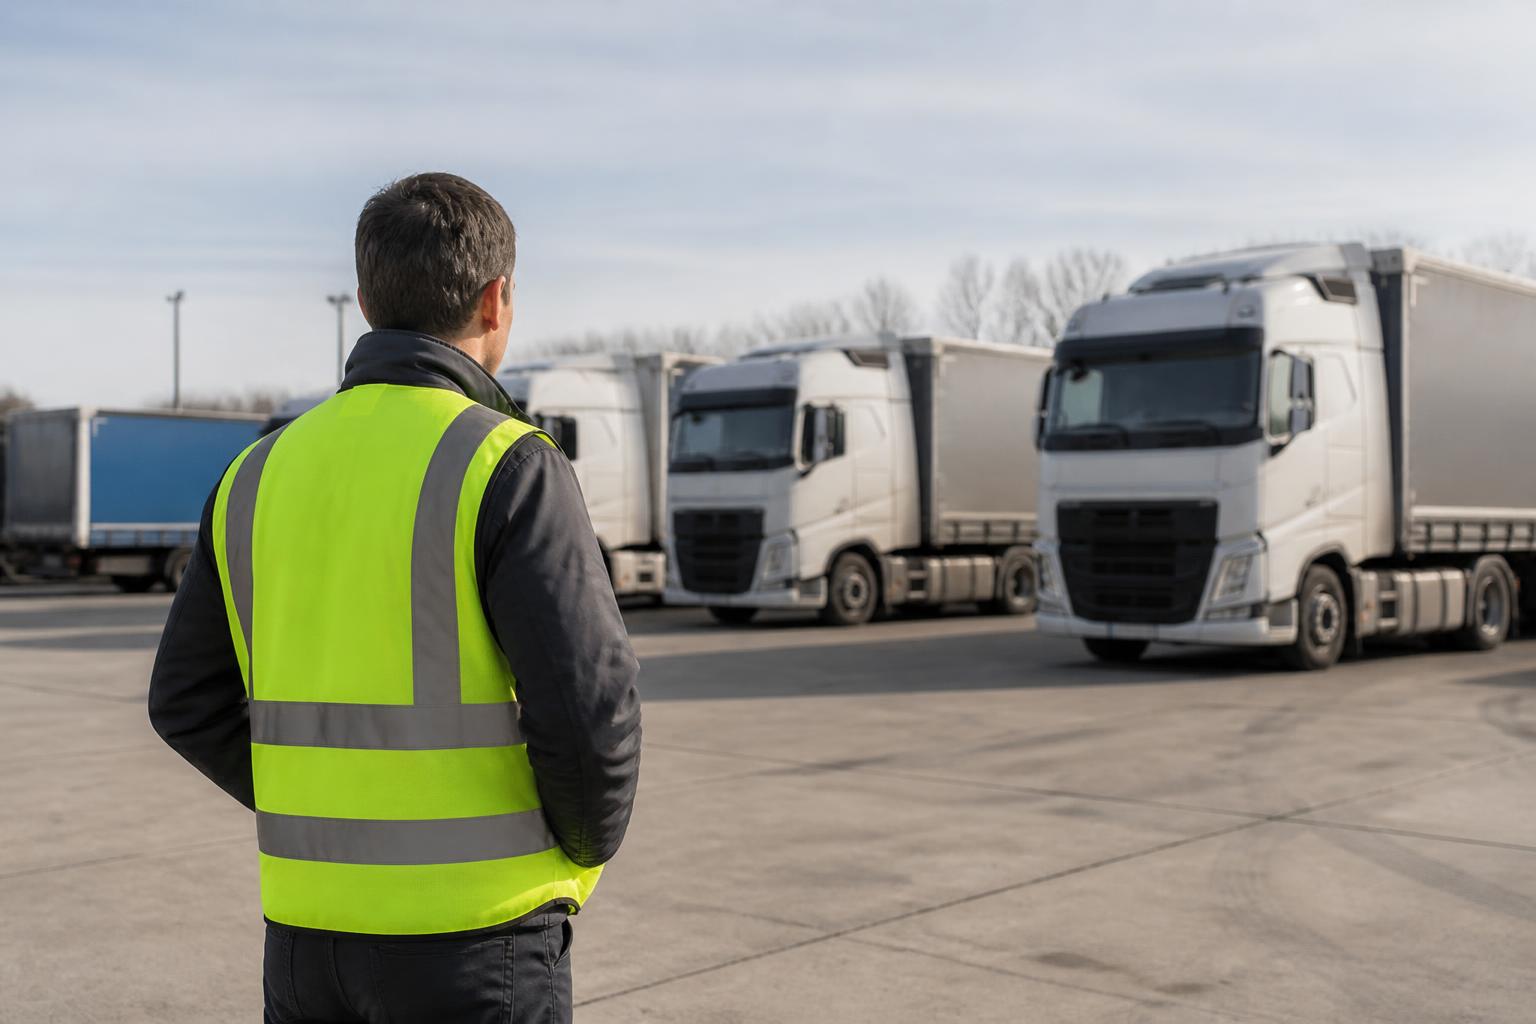
Operators do not usually need more reports. We need fewer manual steps, cleaner data, and a faster way to see what needs attention today. That is what automated fleet reporting is for. Instead of exporting rows from one system, matching them to another, and building the same spreadsheet every week, the platform collects vehicle, driver and compliance data continuously and turns it into reports that are already structured for transport use.
For UK fleets, that matters because reporting is not only about management information. It affects driver hours oversight, vehicle use, customer service, investigations, payroll inputs, and proof that key checks are being done. When reports are automated properly, the office spends less time assembling data and more time acting on exceptions.
What automated fleet reporting means in day-to-day operations
In practical terms, automated fleet reporting means the system gathers data from your vehicles and connected devices, applies rules, and produces scheduled or on demand reports without someone rebuilding them manually each time.
For a UK commercial fleet, that usually includes:
- vehicle location and movement from GPS
- driver activity from Tachograph records
- event footage and alerts from Smart dashcams
- vehicle status or engine information from CAN data, where the vehicle and hardware support it
- asset and trailer movements where separate tracking units are fitted
The difference from manual reporting is not just speed. It is consistency. A spreadsheet built by hand often depends on one person remembering which export to run, which columns to clean up, and which filters to apply. That creates avoidable problems. Date ranges get missed. Vehicles are named differently across systems. Driver records are duplicated. Exceptions are buried because the report is built for completeness rather than action.
With automated fleet reporting, the logic is set once and then reused. If we want a daily exception report showing vehicles with overdue Tachograph downloads, unidentified driver activity, harsh braking events, and assets that have not moved in a defined period, the platform can produce that without someone stitching files together before 9 am.
This is especially useful for mixed fleets. An operator running HGV units, vans, trailers and plant does not want separate reporting habits for each category if one platform can provide a common view. We see the strongest operational benefit where transport teams can move from “who has the latest spreadsheet?” to “what needs action first?”
Which fleet data should feed your reports?
Useful reports start with the right inputs. If the source data is patchy, late or inconsistent, the report will still look tidy but it will not support good decisions. For most operators, there are four main data sources worth focusing on.
First is GPS. This is the foundation for journey history, arrival and departure times, idling, route replay, out of hours use, geofence activity, utilisation and asset visibility. Good GPS reporting should not stop at dots on a map. It should let us report on where vehicles were, how long they stayed, whether they entered a site during a planned window, and how often a vehicle is actually being used. Mapping based on OpenStreetMap is often enough for operational visibility, provided the underlying location data is accurate and updates reliably.
Second is Tachograph data. For HGV operators, this is central to monitoring driver hours, working patterns, infringements risk, card download status and vehicle unit download status. In the UK, the legal framework is not identical in every respect to EU operations, especially once international work and AETR scope are considered, so reports need to reflect the work being done rather than assume one rule set covers all journeys. The practical point is that Tachograph reporting should show who needs a download, which drivers need review, and where the office may need to intervene before issues build up.
Third is Smart dashcams. These add context that raw telematics cannot. A speeding alert or harsh event is more useful when paired with video, location and time. Reporting from Smart dashcams can show repeated behaviours, high risk routes, coaching needs, disputed incidents, and whether a trend is improving after intervention. For some fleets, daily event summaries are more valuable than a large archive that nobody has time to review. This is one reason many operators look at video-enabled vehicle monitoring for incident review alongside their reporting setup.
Fourth is CAN data, where available. This can include ignition status, fuel related information, odometer, engine parameters, PTO use and other vehicle signals depending on the make, model and integration. Not every fleet needs deep CAN data, but where it is available it improves utilisation reporting, maintenance planning, and checks against reported mileage or fuel use.
There are also supporting data sources that matter in practice:
- driver and vehicle master records
- trailer and asset IDs
- depot and customer geofences
- job or route references, where integrated
- exception rules, such as out of hours movement or missed download windows
The key is not to collect everything because it exists. It is to collect what supports action. If a data source does not change a decision, it may not belong in a routine report.
Where automation saves time and reduces risk
The biggest time saving usually comes from stopping repeated admin. Many transport offices still spend hours every week on exports, copy and paste work, and chasing the same status updates from different systems. Automation cuts that work in several places.
A common example is download oversight. Instead of checking card and vehicle unit status manually, a report can flag missed or upcoming Tachograph downloads by vehicle and driver. That gives the transport team a list to act on, not a system to interrogate. The same applies to unidentified mileage, possible card issues, and vehicles that have not communicated recently.
Daily fleet visibility is another area where automation helps. A transport operator may want one morning report covering late starts, vehicles outside expected operating areas, units parked at customer sites overnight, and trailers that have not moved for a defined period. Without automation, someone must pull location data, compare it with planned work, and circulate an update. With it, the report lands automatically and exceptions are already grouped.
Compliance risk is easier to spot when reporting is scheduled and standardised. This does not replace management review, but it does make review practical. For example:
- vehicles with no recent GPS communication
- overdue Tachograph downloads
- repeated harsh driving events from the same driver
- out of hours movement that needs checking
- mileage or usage patterns that do not match the expected operation
Utilisation reporting is another strong use case. Operators often know that some vehicles are underused, but proving it usually means manual collation of trip history, parked time and mileage. An automated weekly report can show active days, first move, last move, stop time, and total distance by vehicle class. For a mixed fleet, that helps with allocation, replacement timing and whether some assets should be reassigned.
Customer service benefits as well. If a customer asks when a vehicle arrived, how long it waited, or whether a delivery point was visited, the answer should not depend on opening several systems and checking a handwritten note. Automated reports can support customer updates, detention review and service evidence. In some operations, this also feeds a Customer Portal so the customer sees selected information without calling the traffic desk.
There is also a governance benefit. When report logic lives in the platform rather than in one person’s spreadsheet, the process is less fragile. Staff holidays, role changes and growth in fleet size do not break the reporting routine.
What good fleet reports look like for HGV, van and mixed fleets
A good report is not the longest one. It is the one that tells the right person what to do next.
For HGV fleets, daily exception reports are often the most useful starting point. These usually include missed Tachograph downloads, possible driver hours concerns for review, units with no communication, geofence breaches, and notable dashcam events. The transport office does not need a full movement log for every vehicle every morning. It needs a short list of items that need follow up.
Weekly HGV management reports tend to be broader. They may include:
- vehicle utilisation by unit
- mileage by vehicle and depot
- idling or stationary engine time
- repeat safety events by driver
- trailer dwell time
- overdue compliance actions
- top level journey and stop summaries
For van fleets, the emphasis is often different. Route density, first job departure, last job finish, time on site, out of hours use and unauthorised movement may matter more than Tachograph detail. Dashcam event reporting can also be more frequent where urban driving risk is high.
Mixed fleets need reporting that respects those differences without splitting the operation into separate tools. A practical setup lets us filter by vehicle type, depot, customer, driver or region while keeping one reporting structure underneath. A fleet manager should be able to look at an HGV-only compliance view in the morning, then switch to a cross-fleet utilisation report in the afternoon.
The most useful report types usually fall into three groups.
First, daily exceptions. These are short, action led, and sent automatically. They highlight what is outside tolerance.
Second, weekly management views. These are trend based and help with planning, coaching and resource allocation.
Third, customer-facing updates. These are selective reports that show arrival times, dwell, proof of attendance or route milestones without exposing internal data the customer does not need.
Good reports also share a few design features:
- clear date and time ranges
- consistent vehicle and driver naming
- exception thresholds that match the operation
- filters by depot, contract or fleet type
- export options when a customer or auditor needs a file
- links back to the underlying journey, event or footage where review is needed
This is one reason operators often compare reporting tools based on admin effort rather than headline features. We covered that in more detail in our guide to comparing haulage reporting tools without extra admin.
How to choose a reporting setup that works in practice
The right setup is the one your team will actually use every day. That means looking beyond dashboards and asking how the data gets into the system, how reliable it is, and whether the same platform can support several workflows.
Start with hardware. If the devices are unreliable or not suited to the vehicle type, reporting quality suffers immediately. Some operators want a straightforward route with Fleetalyse-ready trackers. Others want the flexibility of unlocked Teltonika hardware, especially where they already have an installation partner or specific technical requirements. Trailer and asset tracking may need a different device profile from powered vehicles, and camera requirements will differ again.
Then look at connectivity and installation planning. Commercial fleets need dependable communications, not consumer assumptions. IoT SIMs, correct device configuration, and sensible install standards all affect whether reports are complete. A report that is technically automated but based on missing data will create more checking work, not less.
Next, check platform coverage. If GPS, Tachograph, Smart dashcams and reporting all sit in different systems, spreadsheet work tends to creep back in. We generally see better results where one platform supports several daily tasks, from live tracking to compliance visibility to incident review. That is the practical value behind bringing tracking, compliance and safety tools into one platform.
Data quality deserves a proper review. Before rollout, confirm:
- how vehicles and drivers will be named
- how depots, sites and geofences will be set up
- how often data is expected to update
- how exceptions will be defined
- who receives which reports, and when
- what happens when a unit stops communicating
It is also worth deciding which reports need to be scheduled and which should remain on demand. Too many automated emails become background noise. Usually, a small set of daily and weekly reports does most of the work, with deeper investigation done only when needed.
Rollout should match the operation. A large HGV fleet with remote Tachograph downloads may prioritise compliance and driver hours oversight first. A van operator may start with route visibility and Smart dashcams. A mixed fleet may begin with GPS and asset tracking, then add compliance functions in stages. The best reporting setup is often phased, but the platform should still be able to support the wider plan.
Finally, consider access and administration. Different users need different views. Traffic staff, compliance managers, workshop teams and customers do not all need the same report set. Features such as Fleet insight, Customer Portal access, and a straightforward Tracker login matter because they determine whether information is actually used. The same applies to practical buying and account management. Some fleets want a standard online route through the Shop, some want a tailored rollout, and some need account processes that fit existing procurement, including VAT handling and card payments through Stripe.
At Fleetalyse, we build reporting around transport workflows, not around the assumption that every fleet works the same way. Whether you are running HGV units, vans, trailers or a mixed operation, the aim is simple. Reduce spreadsheet work, improve visibility, and make sure the right people see the right exceptions in time to act. Fleeta Limited T/A Fleetalyse supports that with connected hardware, one platform, and reporting that fits how UK operators actually run fleets.
What is automated fleet reporting?
It is the automatic collection and presentation of fleet data into regular reports or dashboards, so operators do not have to build updates manually from separate systems and spreadsheets.
What data can be included in fleet reports?
Typical inputs include GPS positions, journey history, vehicle activity, driver hours, Tachograph records, asset movements, incident footage references and selected CAN data from connected vehicles.
Is automated reporting only useful for large fleets?
No. Smaller operators often benefit quickly because they have limited admin time and still need visibility of vehicles, drivers, utilisation and compliance across daily operations.
Can automated reports help with compliance work?
Yes. They can highlight missing downloads, vehicle activity, driver hours patterns and other exceptions that need attention, making compliance checks easier to manage in routine workflows.
How often should fleet reports be generated?
That depends on the task. Exception and operational reports may need daily or live visibility, while management, utilisation and cost reviews are often more useful weekly or monthly.