
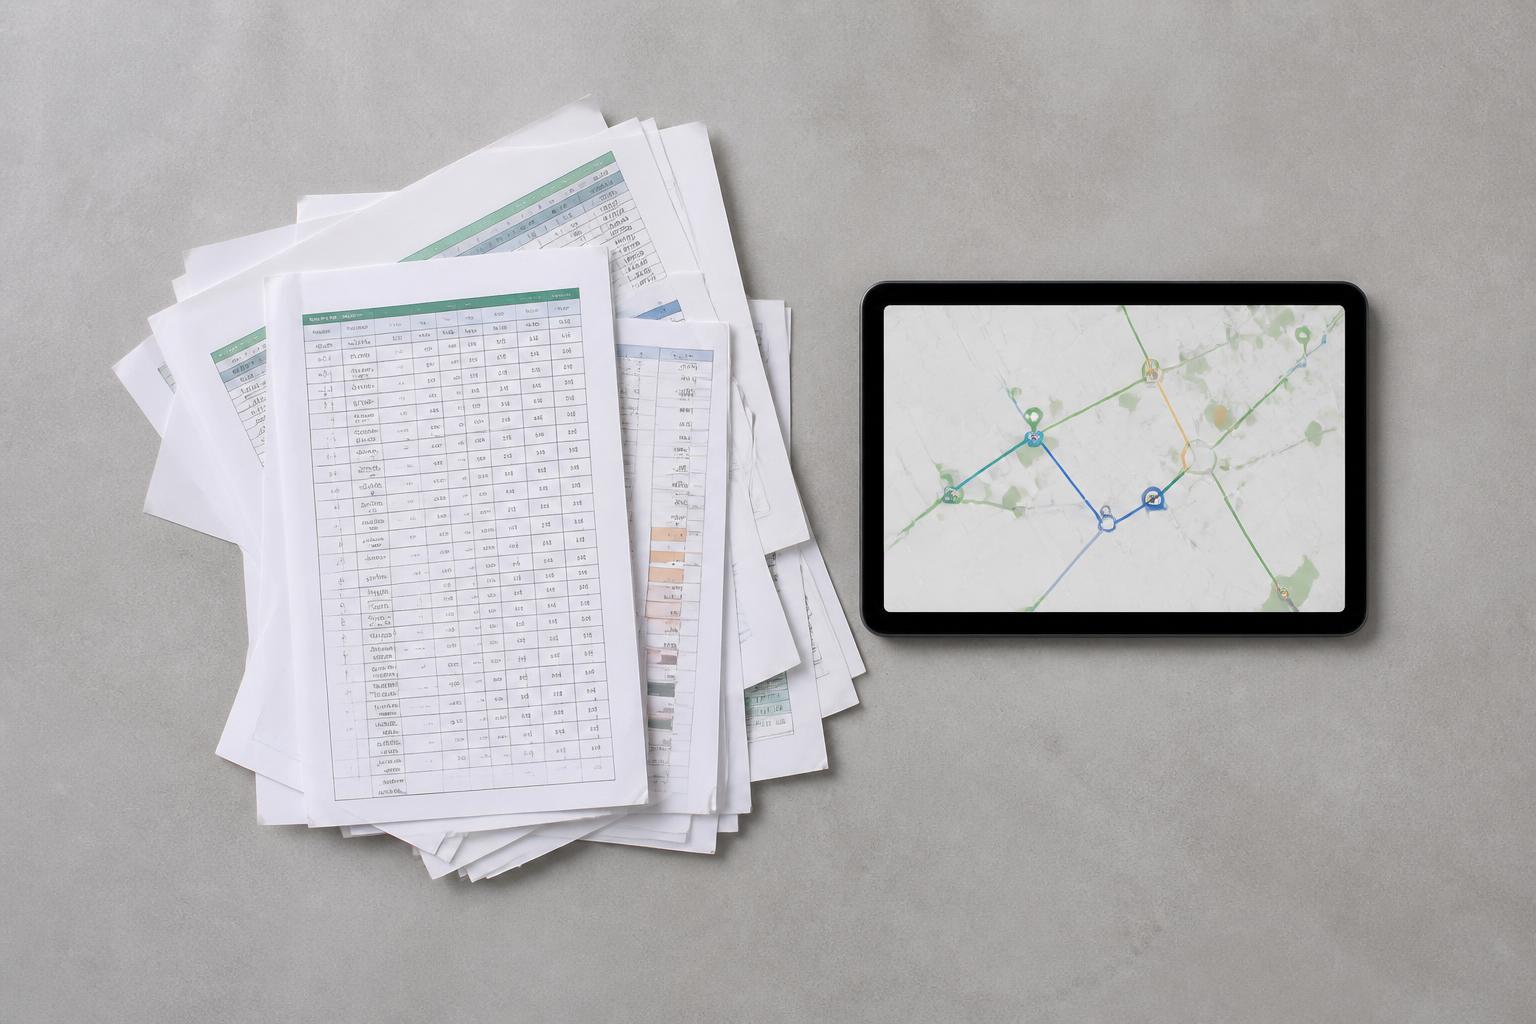
Spreadsheet chasing usually starts because the data exists, but it sits in separate places. Vehicle positions are in one tracking screen. Tachograph files are somewhere else. Camera footage is on another login. Fuel, mileage, idling, trailer movements and driver exceptions end up copied into weekly sheets so someone can turn them into a report. That is exactly the gap good fleet analytics software is meant to close.
For a UK operator, the value is not in collecting more data for its own sake. It is in turning live and historic fleet activity into something usable for transport planning, compliance checks, incident review and management reporting. At Fleetalyse, we bring GPS tracking, remote Tachograph downloads, Smart dashcams and fleet reporting into one operational view, so the day-to-day work is done from the platform instead of from disconnected spreadsheets.
What fleet analytics software actually does
Raw fleet data is just a stream of events. A vehicle moved. A driver card was inserted. An ignition turned on. A harsh braking event was triggered. A trailer entered or left a geofence. On their own, those points tell you very little.
Fleet analytics software takes those events and turns them into operational information. That usually means five things.
First, it organises data by vehicle, driver, asset, route, depot or customer. Instead of checking one device at a time, we can see a whole fleet by exception. Which vehicles are under-used this week? Which drivers are close to driver hours limits? Which trailers have not moved in seven days? Which jobs ran late?
Second, it adds context. A GPS breadcrumb trail becomes a journey history with start and stop times, dwell periods, route deviations and site attendance. A Tachograph file becomes visibility over driving, other work, breaks and rest. Camera footage becomes an event tied to a time, location and vehicle movement.
Third, it creates alerts. Good reporting is useful, but most transport teams also need prompts when something needs attention now. That might be a missed download window, a vehicle leaving a defined area, excess idling, a battery issue on a tracked asset, or a camera event that needs review.
Fourth, it supports decisions. If a planner can see real utilisation, they can assign work more accurately. If a transport manager can see repeated route delays at a customer site, they can challenge booking windows or adjust schedules. If a compliance lead can see missing driver files or download exceptions in one place, they can deal with them before they become a bigger problem.
Fifth, it reduces duplicate admin. This is often where the real gain sits. If your weekly KPI pack depends on exporting from one system, matching with a second, then checking a third, the software is not doing enough. Proper fleet analytics software should cut manual collation and make the reporting part of the live workflow.
That is the difference between tracking and analytics. Tracking tells you where something is. Analytics tells you what is happening across the operation and what needs doing next. If you want a closer look at fleet reporting and operational visibility in one place, that is the standard we build around.
Which data matters most in a UK commercial fleet
Not every fleet needs every data source, but most UK commercial operators rely on a core set. The key is knowing what each source is for and how it supports the operation.
GPS
GPS is the foundation for live fleet visibility. It shows vehicle location, route history, ignition status, stop durations, arrival and departure times, and geofence activity. For vans, HGV fleets and mixed operations, this is usually the first layer of control.
In practical terms, GPS is what dispatch uses to answer customer queries, check progress against plan, and reassign work when a vehicle is delayed. It is also what managers use for utilisation reporting, out-of-hours movement checks and proof of attendance at sites.
Tachograph
For HGV operators, Tachograph data is central to compliance oversight. In the UK, domestic and EU drivers' hours rules can both apply depending on the work being done, and operators need to know which regime applies to which journeys. The software needs to make those records visible without forcing the office to chase separate downloads and manual reconciliations.
Remote downloads matter because they reduce the risk of missed collection windows for vehicle unit and driver card data. Just as important is how the platform presents that information. Transport teams need to see activity by driver and vehicle, identify missing data, and flag exceptions before they become an audit problem.
Smart dashcams
Smart dashcams add a safety and incident layer that tracking alone cannot provide. They capture video linked to driving events, which helps with collision review, disputed claims, near miss investigation and coaching.
Used properly, Smart dashcams are not just for major incidents. They can support day-to-day review of harsh events, distraction indicators, risky manoeuvres and site-specific issues. When footage is tied to location and journey data, the review process is much quicker than hunting through separate systems.
CAN data
CAN data comes from the vehicle itself. Depending on vehicle type and integration, it can provide detail such as fuel level, engine parameters, odometer readings and operational status. This is especially useful where fleets want more than simple movement data.
For example, if you are checking fuel use against idling behaviour, or validating mileage without waiting for manual updates, CAN data gives a more direct operational picture. On mixed fleets, the level of available data can vary by make, model and installation method, so this is something to assess during rollout rather than assume.
Asset tracking
Not every tracked item has a driver. Trailers, plant, generators, containers and other mobile assets often create just as much admin when their location is uncertain. Asset tracking helps with security, utilisation and recovery of equipment that has simply gone quiet.
For a trailer fleet, that can mean knowing which units are moving, which are parked at customer sites, and which have not been used for a defined period. For non-powered assets, battery life, reporting frequency and installation method become key practical considerations.
Connected hardware and communications
The platform is only as reliable as the devices and connectivity behind it. We support Fleetalyse-ready trackers, unlocked Teltonika hardware and tailored commercial installations, depending on what the fleet needs. For some buyers, that means a straightforward self-serve start. For others, it means planning device types, install windows and data requirements across a larger operation.
Connectivity also matters. IoT SIMs are often the quiet part of the setup, but they affect coverage, resilience and ongoing device performance. For operators comparing options, it is worth looking beyond the headline device and checking how the whole hardware stack will behave in daily use.
How analytics helps with compliance and driver hours
Compliance work often becomes spreadsheet work because the operator can see the data, but not the exceptions. Someone exports driver activity, checks missing downloads, notes infringements, marks vehicle use and then tries to reconcile all of that with the actual operating day. That process is slow, and it creates blind spots whenever the workload spikes.
Analytics changes that by making compliance visible as part of the live operation.
For driver hours, the obvious use is monitoring available time and spotting risk before the shift is over. If dispatch can see what the day already contains, they are less likely to assign work that pushes a driver into a problem. If transport managers can review exceptions by driver, vehicle or depot, they can focus on the people and patterns that need attention.
For Tachograph compliance, the software should help answer practical questions quickly. Have all required files been received? Which driver cards are overdue? Which vehicle units have gaps? Are there unexplained periods of activity? Are there repeated issues with manual entries or route patterns that suggest a training gap?
The UK position also matters here. Operators may be dealing with retained EU rules on drivers' hours and Tachograph use for relevant journeys, while also running work that falls under GB domestic rules. A useful platform does not replace legal judgement, but it does make it much easier to see what happened, when, and in which vehicle.
The same applies to vehicle activity. If a vehicle shows movement outside planned hours, or if a unit appears inactive when it should be working, the reporting should surface that. Exception-led reporting is what reduces the need for a separate compliance spreadsheet.
At Fleetalyse, we see the biggest operational gain when compliance visibility is not treated as a separate admin task. If tracking, downloads, camera events and reporting are already in one system, the transport office does not need to spend half the week stitching evidence together. For businesses comparing systems with that in mind, our guide to one-screen control for transport teams is a useful next read.
How fleet managers use it day to day
The day-to-day use of analytics is usually less glamorous than software demos suggest, but much more valuable. It sits in ordinary transport workflows.
Dispatch and live control
Dispatch teams use the live map to check vehicle position, current job progress and nearest available resource. If a customer rings asking where a delivery is, the office should not need to call the driver first. If a vehicle is delayed at a site, the planner should be able to see that delay building and adjust the rest of the day.
Mapping matters here. OpenStreetMap based views are often perfectly practical for fleet operations, provided the routing and location detail are clear enough for transport use.
Transport planning
Historic journey data helps planning teams tighten future schedules. Repeated delays at loading sites, long dwell periods, route inefficiencies and under-used vehicles are all easier to spot when the data is already grouped and reportable.
That is where Fleet insight becomes useful. Rather than checking isolated trips, managers can look across a week or month and see patterns. Which vehicles are consistently over-allocated? Which routes create idle time? Which assets are parked more than they are working?
Incident review
When an incident happens, speed matters. The office needs the location, vehicle history, driver details and, where fitted, camera footage. If the footage sits in one system and the movement data in another, review takes longer and facts are harder to confirm.
With connected Smart dashcams and tracking in one platform, the team can review events against the journey record. That helps with insurance support, customer disputes and internal investigations. It also helps with coaching, because the event can be reviewed in context rather than as a standalone clip.
Utilisation checks
A common management question is whether the fleet is the right size for the work. Analytics helps answer that with evidence. If trailers are stationary for long periods, if certain vans only run short local work, or if hired assets are duplicating owned fleet capacity, the data should show it.
This is one of the clearest examples of software cutting spreadsheet chasing. Utilisation reporting should not require someone to export every vehicle's movements and mark active days manually.
Management reporting
Senior reporting often asks for the same measures each week or month, vehicle activity, mileage, idling, driver exceptions, site attendance, trailer use and incident trends. Without a joined-up platform, transport teams spend time preparing the report instead of acting on it.
The right setup gives managers a repeatable reporting process with filters, saved views and role-based access. That means depot managers can see their own operation, while central users can see the full fleet.
For some operators, access and account structure matter almost as much as the reports themselves. We support practical access routes such as Customer Portal and Tracker login, so users can get to the right part of the system without unnecessary complexity.
What to look for before you buy
Start with the operating model, not the feature list. A platform that looks strong in a demo may still create work if it does not fit how your fleet actually runs.
First, check whether it supports your fleet mix. Many operators are not running one clean vehicle category. They have HGV units, vans, trailers and mobile assets, sometimes across more than one depot. Mixed-fleet support matters because separate systems usually mean separate admin.
Second, look at hardware options. Some buyers want a fast start with Fleetalyse-ready trackers. Others need unlocked Teltonika devices because they already have installation capability or want specific hardware combinations. Larger fleets may need a staged rollout with different device types, camera requirements and download setups. The software should support that without forcing a one-size-fits-all approach.
Third, ask how rollout works in practice. Who installs the devices? What is the lead time? How are vehicles grouped? How are users set up? What happens if you need to migrate a mixed estate from legacy hardware? These are operational questions, not procurement detail.
Fourth, assess reporting depth. Can you build reports around the actual management questions you need to answer, or are you limited to a fixed dashboard? Can you filter by depot, customer, driver or asset type? Can you see exceptions clearly enough to stop maintaining a separate spreadsheet?
Fifth, review mapping and workflow usability. The best platform is the one your transport office will use every day. If the live map is cluttered, the event history is hard to follow, or camera footage is awkward to retrieve, adoption will suffer.
Sixth, check user access and commercial admin. If you are buying online, the process should be straightforward, including account creation, billing and VAT handling where applicable. For self-serve purchases, that often means a clean checkout and account process through tools such as Stripe, backed by clear onboarding into the platform.
Finally, check the business terms and support structure. Buyers should know who they are contracting with, how the service is delivered, and what hardware path suits them. For us, that means being clear that Fleeta Limited T/A Fleetalyse provides the platform and related hardware options for UK commercial operators.
If you are comparing options now, two useful starting points are our guide to how fleet managers shortlist tracking software in practice and our online shop for trackers and connected hardware.
The best fleet analytics software is not the one with the longest specification sheet. It is the one that removes daily admin, makes compliance easier to see, and gives the transport team one reliable place to work from. When that happens, spreadsheet chasing stops being part of the job.
What is fleet analytics software?
It is software that collects fleet data and turns it into reports, alerts and trends. For UK operators, that often includes GPS tracking, Tachograph data, vehicle activity, driver behaviour and camera evidence.
How is it different from basic vehicle tracking?
Basic tracking shows where a vehicle is. Fleet analytics software goes further by showing patterns, exceptions, utilisation, compliance-related activity and performance across vehicles, drivers and jobs.
Is fleet analytics software only for HGV fleets?
No. It can be useful for HGV, van, trailer, plant, asset and mixed fleets. The main value is bringing different operational data into one view for the people running the fleet.
Can it help reduce spreadsheet work?
Yes. A good system replaces manual chasing with scheduled reports, live dashboards and exception-based alerts, so managers spend less time compiling data from separate tools.
What should a UK operator check before choosing a system?
Check the data sources it supports, reporting quality, Tachograph workflow, camera integration, hardware options, mixed-fleet coverage, user access and whether it fits your day-to-day operation.