

HGV fuel efficiency monitoring setup: a UK fleet guide

A practical HGV fuel efficiency monitoring setup starts with one decision: connect your telematics to the vehicle’s FMS/CAN bus where available, fit fuel-level sensors on older trucks where it isn’t, then feed that data into driver behaviour KPIs and a platform like Fleetalyse for real-time alerts and coaching. FORS guidance illustrates the payoff clearly: a 5% improvement in MPG can save approximately £2,200 per HGV per year, according to FORS guidance. Across a mid-sized fleet, this benchmark demonstrates a meaningful return on what is typically a modest hardware and software investment.
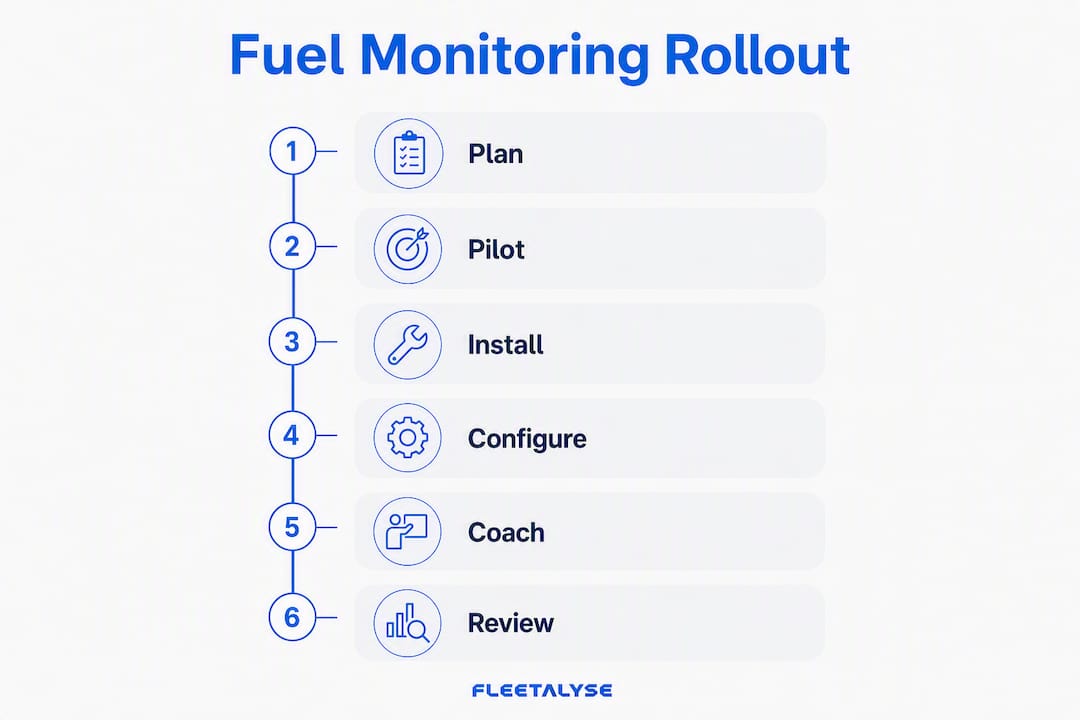
The fastest route to those savings is a structured pilot. Choose a small representative sample of HGVs that span your route types and vehicle ages, fit the appropriate hardware, configure your core KPIs, and run a baseline period before making any coaching interventions. That sequence gives you defensible before-and-after data, satisfies DVSA and FORS record-keeping expectations, and avoids the common mistake of changing driver behaviour before you have a reliable baseline to measure against.
Table of Contents
- How do you plan and run a fuel-monitoring rollout step by step?
- Which hardware should you use for HGV fuel monitoring?
- What KPIs and software settings do you need to configure?
- How do you handle older trucks, trailers and mixed fleets?
- How do you turn fuel data into real savings through driver coaching?
- What does a fuel-monitoring rollout cost and how long does it take?
- What are the DVSA, FORS and GDPR requirements you need to meet?
- How do you calculate ROI and prove savings to stakeholders?
- How does Fleetalyse support UK HGV fuel-monitoring rollouts?
- Key takeaways
- What fleet managers often get wrong about fuel monitoring
- Fleetalyse: your next step for HGV fuel monitoring
- Useful sources and further reading
How do you plan and run a fuel-monitoring rollout step by step?
A well-structured rollout prevents the two most common failures: buying hardware before defining what you want to measure, and deploying fleet-wide before the configuration is proven. Work through the following stages in order.
Stage 1: pre-rollout scoping
- Define your objectives. Decide which metrics matter most: MPG by route type, litres per 100 km, idling minutes per shift, AdBlue:diesel ratio, or a combination. Write these down as measurable targets before any procurement begins.
- Select your pilot sample. Pick a small number of vehicles that represent your fleet’s age range, body types, and typical duty cycles. Include at least one older vehicle without CAN bus output so you can validate the sensor fallback approach.
- Set success metrics and a go/no-go threshold. For example: “If the pilot vehicles show a 3% or greater MPG improvement after 8 weeks of coaching, we proceed to full rollout.”
- Identify stakeholders and assign responsibilities. Transport manager owns the KPI targets; workshop manager owns installation scheduling; telematics installer owns commissioning; drivers are briefed and consented; compliance or HR handles GDPR notifications; IT confirms data connectivity and access controls.
Stage 2: hardware and software procurement
- Confirm CAN/FMS compatibility for each vehicle in the pilot sample before ordering devices.
- Select devices that match your connectivity needs: plug-and-play FMS gateway units for modern HGVs, fuel-level sensors for older vehicles.
- Arrange SIM/data plans and confirm signal coverage on your primary routes.
- Schedule installation slots with your workshop, allowing 2–4 hours per vehicle depending on wiring complexity.
- Set up your software platform (such as Fleetalyse) with user accounts, role-based access, and initial dashboard templates before devices go live.
Stage 3: pilot timeline and milestones
- Week 1–2: Install and commission devices. Validate fuel readings against manual dip tests. Confirm CAN data streams are active and accurate.
- Week 3–6: Baseline data collection. No coaching interventions yet. Capture MPG, idling, harsh events and AdBlue consumption per vehicle per route type.
- Week 7–8: Begin coaching loop. Share post-trip reports with drivers, set alert thresholds, and run a brief driver briefing session.
- Week 9–10: Measurement window. Compare post-coaching KPIs against the baseline. Apply your go/no-go criteria.
- Go/no-go decision: If targets are met, proceed to phased full rollout. If not, diagnose whether the issue is data quality, driver engagement, or route factors before scaling.
Pro Tip: Book a commissioning check on the final day of installation week, not a week later. Catching a misconfigured CAN channel on day two is a 30-minute fix; catching it after four weeks of baseline data collection means starting the clock again.
Which hardware should you use for HGV fuel monitoring?
The right hardware depends almost entirely on vehicle age and whether the ECU exposes a digital data output. Getting this decision right at the start saves significant rework later.
FMS/CAN gateway: the preferred route for modern HGVs
Most HGVs manufactured after 2003 carry an FMS (Fleet Management System) gateway, a standardised interface that exposes fuel level, RPM, engine load, odometer, coolant temperature, and vehicle speed directly from the ECU. Connecting a telematics device to this port gives you accurate fuel data without any additional sensors, and the readings update in near real time. This is the CAN-first approach recommended by FORS and the most reliable foundation for fuel consumption tracking.
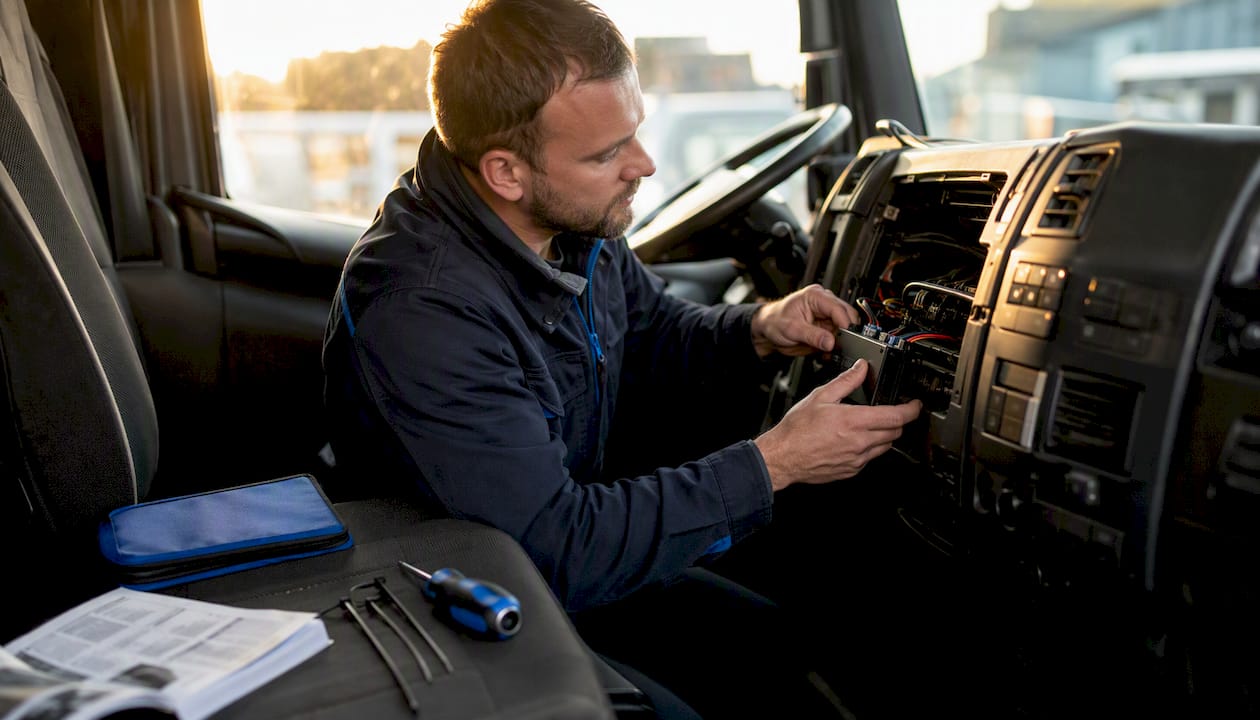
For UK fleets, Teltonika produces a range of plug-and-play devices that connect via the FMS gateway or directly to the CAN bus. Their units are widely used across UK commercial fleets, support multiple ECU protocols, and are available unlocked so you can pair them with your chosen software platform. They suit modern HGVs where a quick, low-disruption installation is the priority.
Fuel-level sensors for older vehicles
Older trucks, pre-2003 vehicles, and many trailers have no digital output at all. Here, your options are:
- Tank probe sensors: inserted directly into the fuel tank, these measure volume by resistance or capacitance. They are accurate and tamper-evident but require a physical installation that takes longer than a plug-and-play unit.
- Ultrasonic gauging: non-invasive sensors that attach to the outside of the tank wall. Easier to fit, but accuracy can vary with tank shape and fuel sloshing on uneven terrain.
- Depot-level dispensing systems: fuel management systems that capture refuelling transactions at the pump, recording litres dispensed, vehicle registration, and mileage at the point of fill. These complement on-board sensors and are particularly useful for validating on-board readings against actual fuel purchased.
Installation checklist
Before signing off any installation, confirm the following:
- Power supply connected to a fused, ignition-switched circuit
- Ignition detection wired and tested
- CAN/FMS data cable routed and secured away from heat sources
- Tamper-proofing applied to connectors and device housing
- Commissioning test completed: compare live fuel-level reading against a manual dip test and confirm the variance is within an acceptable tolerance
- Device serial number and vehicle registration logged in the platform
Pro Tip: Check whether your telematics unit also reports AdBlue level and consumption. AdBlue:diesel ratio is a useful secondary KPI, and fleets running Euro 6 vehicles can use it to detect SCR system faults before they become costly breakdowns.
What KPIs and software settings do you need to configure?
Connecting hardware is the easy part. The configuration that turns raw data into real-time fuel data analysis is where most fleets either get it right or waste months on numbers that don’t tell them anything useful.
Core KPIs to configure from day one
| KPI | How it’s calculated | Normalisation factors |
|---|---|---|
| Litres per 100 km | Total fuel consumed ÷ distance × 100 | Route type, payload, terrain |
| MPG equivalent | Distance ÷ fuel consumed (in gallons) | Route type, payload |
| Idling minutes per shift | Engine-on time during idling | Shift length, loading/unloading dwell |
| Harsh acceleration events | Acceleration rate exceeding defined threshold (m/s²) | Speed band, road type |
| Harsh braking events | Deceleration rate exceeding defined threshold (m/s²) | Speed band, road type |
| PTO fuel consumption | Fuel used while power take-off is active | PTO duty cycle |
| AdBlue:diesel ratio | AdBlue consumed ÷ diesel consumed | Engine load, ambient temperature |
| Fuel variance per vehicle | Actual consumption vs. route-normalised benchmark | Route, payload, driver |
Normalisation is not optional. Baseline MPG by route type is critical: comparing an urban distribution run with a motorway trunk haul without adjusting for route profile produces conclusions that are actively misleading. Configure separate benchmarks for each duty cycle from the start.
Dashboard and alert configuration
Set up your dashboard with three layers: a live view showing current fuel level and vehicle location per unit; a trend view showing weekly MPG and idling minutes per vehicle; and an exception report that flags anomalies automatically. Useful automated alerts include:
- Idling exceeding 5 minutes with engine running and no PTO activity
- Sudden fuel-level drop of more than 10% outside a known refuelling location (potential theft or leak)
- MPG falling more than 15% below the vehicle’s route-normalised benchmark for three consecutive trips
- AdBlue level below 10%
Linking driver behaviour monitoring to fuel KPIs is not just good practice; it is a FORS requirement. Monitoring fuel use in isolation tells you what is happening. Connecting it to idling patterns, harsh braking frequency, and overspeeding tells you why, which is the only basis for effective coaching.
How do you handle older trucks, trailers and mixed fleets?
Very few UK HGV fleets are uniform. Most operators run a mix of vehicle ages, body types, and trailer configurations, and the fuel-monitoring approach has to flex accordingly.
For older vehicles without CAN bus output, tank-level sensors are the most reliable on-board option. Fit them during a scheduled service to minimise downtime. Where even sensor fitting isn’t practical, depot-level fuel dispensing systems that capture litres dispensed per vehicle registration at the pump provide a workable alternative. The data is less granular than on-board telemetry but sufficient for fleet-level benchmarking and FORS record-keeping.
Trailers present a different challenge. An unpowered trailer has no power source for a telematics device unless you fit a dedicated battery-backed unit. The practical workaround is to attribute fuel consumption to the tractor unit and correlate it with trailer duty cycles using coupling and uncoupling events logged by the tractor’s telematics. This gives you a reasonable proxy for trailer-specific fuel impact without fitting hardware to every trailer.
- Intermittent CAN signals: often caused by a loose connector or a vehicle-specific ECU protocol variant. Confirm the device firmware supports the vehicle’s protocol before installation; most Teltonika units support multiple variants but require the correct configuration profile.
- Incompatible ECU protocols: some older or specialist vehicles use proprietary CAN implementations. In these cases, fall back to GPS-derived indicators (speed, harsh events, trip distance), which still support driver coaching and route optimisation even without precise fuel measurement.
- Telematics sleep mode: devices that enter deep sleep between ignitions can miss short-trip fuel events. Configure the sleep timeout to match your shortest typical shift gap, usually no less than 30 minutes.
Validate sensor accuracy before relying on the data. Run a dip test at installation, then repeat it after two weeks of operation. A variance of more than 3–5% between the sensor reading and the physical dip suggests a calibration issue that will corrupt your baseline.
How do you turn fuel data into real savings through driver coaching?
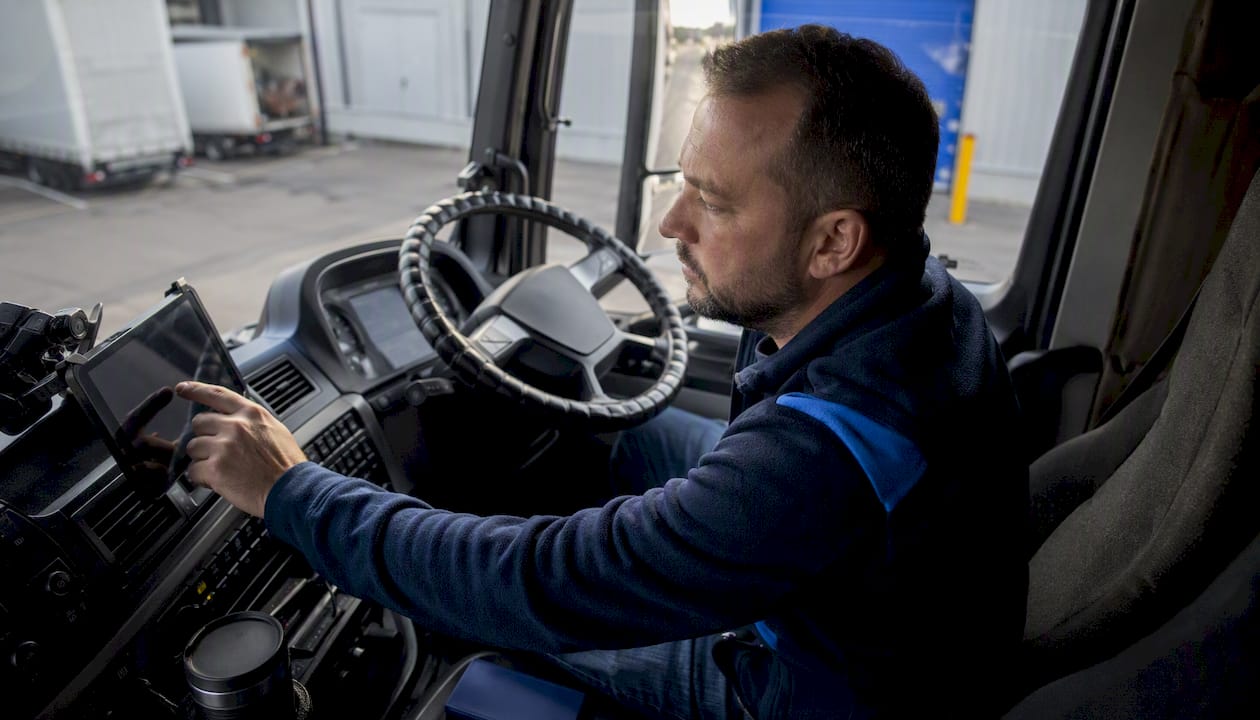
Data without action is just storage. The coaching loop is what converts telematics readings into actual fuel savings, and the structure of that loop matters as much as the data itself.
The coaching cycle
- Data capture: telematics records fuel consumption, idling, harsh events and speed profiles continuously.
- Post-trip report: drivers receive a summary of their shift performance against their personal benchmark, ideally within 24 hours of completing the trip.
- In-cab alerts: real-time prompts for idling over threshold or harsh acceleration give drivers immediate feedback while the behaviour is still fresh.
- Targeted training: drivers with persistent patterns (chronic idling, frequent harsh braking) receive one-to-one coaching sessions rather than generic group training.
- Re-measurement: compare the driver’s KPIs over the four weeks following coaching against their pre-coaching baseline to confirm improvement.
Short, regular in-cab feedback combined with monthly post-trip reports creates the fastest behaviour change. Systems that provide both are more likely to yield measurable MPG gains than those relying on periodic reports alone. For a structured approach to monitoring HGV driver performance, the coaching loop needs to be built into the weekly operational rhythm, not treated as a quarterly exercise.
Operational levers beyond driver behaviour
Driver coaching addresses the human variable, but several mechanical and logistical factors also move the needle:
- Tyre pressure: under-inflated tyres increase rolling resistance and fuel consumption. A weekly pressure check programme, logged in your maintenance system, is one of the lowest-cost interventions available.
- Route optimisation: avoid unnecessary mileage and high-congestion periods. Map-based speed and gear guidance, such as Volvo’s I-See system, has been claimed to reduce fuel use by up to 5% on suitable routes, a reminder that vehicle-level features and telematics work best in combination.
- Scheduled maintenance: a blocked air filter or a poorly calibrated injector can add several percent to fuel consumption without triggering any driver-behaviour alert. Maintenance scheduling integrated with your telematics platform catches these before they become significant.
- Load optimisation: unnecessary payload weight costs fuel. Where possible, review load plans against route fuel benchmarks to identify patterns.
Set time-bound targets: for example, reduce fleet-wide idling by 20% within 12 weeks, or improve average MPG by 3% within the first full quarter post-rollout. Vague goals produce vague results. Linking fuel KPIs to driver scoring shortens the behaviour change cycle because drivers can see their own progress in near real time rather than waiting for a quarterly review.
What does a fuel-monitoring rollout cost and how long does it take?
Budgeting accurately requires separating one-off costs from ongoing costs, and understanding how fleet size affects the economics.
Typical cost components
| Cost item | Nature | Notes |
|---|---|---|
| Telematics hardware per vehicle | One-off | Varies by device type; FMS gateway units typically cost more than basic OBD trackers |
| Installation labour per vehicle | One-off | 2–4 hours per vehicle depending on wiring complexity |
| Fuel-level sensor per vehicle | One-off (older vehicles only) | Tank probe or ultrasonic; additional fitting time required |
| SIM/data subscription per vehicle | Ongoing monthly | Confirm coverage on your primary routes before committing |
| Software subscription | Ongoing monthly or annual | Per-vehicle or per-user pricing depending on platform |
| Depot fuel-gauging equipment | One-off (if required) | Pump-side dispensing systems for depot-level reconciliation |
| Calibration and maintenance checks | Ongoing annual | Sensor drift checks and firmware updates |
A 5% MPG improvement saves roughly £2,200 per HGV per year, which means the combined hardware and first-year subscription cost for most vehicles is recoverable within 12 months on a fleet running typical UK mileages.
Rollout timeline
| Phase | Duration | Key activities |
|---|---|---|
| Procurement and preparation | 2–4 weeks | Device selection, SIM provisioning, platform setup, driver briefings |
| Pilot installation (5–10 vehicles) | 1–2 weeks | Install, commission, validate sensor accuracy |
| Baseline data collection | 4–8 weeks | No coaching; capture pre-intervention KPIs |
| Coaching and measurement window | 4–8 weeks | Alerts active, post-trip reports issued, go/no-go decision |
| Phase 2: 20–50% of fleet | 4–6 weeks | Scaled installation using lessons from pilot |
| Full deployment | 3–6 months total | Remaining vehicles, ongoing reporting cadence established |
Staging the rollout in waves (pilot → 20% → 50% → 100%) avoids overwhelming your workshop and gives your operations team time to absorb the data before the volume multiplies.
What are the DVSA, FORS and GDPR requirements you need to meet?
Compliance is not a box-ticking exercise here. Getting it wrong can affect your Operator Licence, your FORS accreditation, and your legal standing under UK data protection law.
FORS requirements
- Record fuel consumption by vehicle registration, not just fleet-wide totals.
- Track AdBlue usage separately from diesel where applicable.
- Use FORS Fleet Tools or an equivalent system to collate fleet-level performance data for accreditation purposes.
- Appoint a named Fuel Champion responsible for monitoring performance, reporting anomalies, and driving improvement initiatives.
- Maintain per-vehicle fuel records that are audit-ready and cover at least the current and previous accreditation period.
DVSA considerations
Telematics devices must not interfere with tachograph recordings. The tachograph is a legally mandated instrument; any wiring that shares power circuits or data lines with the tachograph head unit requires careful routing and, where in doubt, sign-off from a qualified tachograph centre. For a broader view of how telematics fits UK compliance, the interaction between driver hours data and telematics records is an area DVSA examiners pay close attention to during roadside checks and operator audits.
GDPR practical steps
- Establish a lawful basis for processing driver location and behaviour data. Legitimate interests is the most commonly used basis for fleet telematics, but it requires a documented balancing test.
- Notify drivers in writing before any device goes live. The notification should explain what data is collected, how long it is retained, who has access, and how drivers can raise concerns.
- Set data retention limits: most operators retain detailed trip data for 3–12 months and aggregated summaries for longer. Document your retention schedule.
- Apply role-based access controls in your platform so that drivers can only see their own data, and managers can only access vehicles within their remit.
Pro Tip: Keep a commissioning record for every installed device: date, installer name, vehicle registration, device serial number, CAN/FMS connection confirmed, and fuel-reading validation result. This single document satisfies installation competency requirements and gives you an audit trail if a reading is ever challenged.
How do you calculate ROI and prove savings to stakeholders?
A credible ROI calculation requires a clean baseline, a defined measurement window, and a consistent methodology. Without these, any savings figure is contestable.
Baseline methodology
- Collect pre-intervention data for a minimum of 4–8 weeks per vehicle, covering all route types in your operation.
- Normalise by route type and payload. A vehicle running heavier loads on hillier routes will always show worse MPG than a lightly loaded motorway runner. Comparing them without normalisation produces a misleading fleet average.
- Record the baseline period dates and conditions. Seasonal factors (winter cold starts, summer air conditioning load) affect fuel consumption and should be noted for later comparison.
- Set per-vehicle benchmarks, not just a fleet average. Individual benchmarks make driver coaching specific and defensible.
ROI calculation example
Take a 20-vehicle fleet with an average annual fuel spend of £44,000 per vehicle. A 5% MPG improvement saves approximately £2,200 per vehicle per year, or £44,000 across the fleet. Subtract the annualised hardware and software cost per vehicle, and the net saving is typically positive within the first year for fleets running standard UK mileages. This is the FORS benchmark figure used widely in UK fleet procurement decisions.
Reporting cadence
- Weekly: exception reports highlighting vehicles or drivers outside their benchmark thresholds.
- Monthly: trend dashboards showing MPG, idling, and harsh-event trends per vehicle and per driver.
- Quarterly: board-level summary comparing actual fuel spend against the pre-rollout baseline, with variance explained by route mix, payload changes, or seasonal factors.
Fleet analysis software, such as Fleetalyse’s analytics platform, can automate most of this reporting, reducing the time your transport manager spends compiling spreadsheets and increasing the time available for acting on the data.
How does Fleetalyse support UK HGV fuel-monitoring rollouts?
Fleetalyse is built specifically for UK commercial fleet operators, which means the compliance context, the hardware compatibility, and the support model are all calibrated for the UK market rather than adapted from a generic European product.
What the platform covers
- GPS vehicle tracking with live fuel level and location per vehicle
- Remote tachograph downloads to keep driver hours records current without manual card retrieval
- Driver behaviour monitoring covering idling, harsh braking, harsh acceleration, overspeeding, and gear usage, all linked to fuel KPIs
- Fuel consumption insights with per-vehicle trend charts, route-normalised MPG, and refuelling anomaly alerts
- Maintenance scheduling integrated with telematics data so service intervals are triggered by actual mileage and engine hours, not calendar dates
- UK-based support with local knowledge of DVSA requirements, FORS accreditation processes, and Operator Licence obligations
Onboarding process
The Fleetalyse onboarding process starts with a discovery conversation to map your fleet composition, vehicle ages, and current data gaps. A device compatibility survey confirms which units suit each vehicle type, whether that’s a plug-and-play FMS gateway device or a fuel-level sensor for an older truck. The pilot installation covers hardware fitting, KPI configuration, and an initial driver briefing. Once the baseline period is complete, the coaching programme begins with post-trip reports and alert thresholds set to your fleet’s specific benchmarks. Scaling to the full fleet follows the phased timeline described earlier in this guide.
Key takeaways
A well-executed HGV fuel efficiency monitoring setup, built on CAN/FMS data, driver behaviour KPIs, and a structured coaching loop, can deliver measurable fuel savings within the first quarter of operation.
| Point | Details |
|---|---|
| Start with a 5–10 vehicle pilot | Run a baseline period before any coaching intervention to capture defensible before-and-after data. |
| CAN/FMS first, sensors as fallback | Connect to the FMS gateway on modern HGVs; fit tank-probe or ultrasonic sensors on older vehicles without digital outputs. |
| Configure normalised KPIs from day one | Set separate MPG benchmarks by route type and payload; unnormalised averages produce misleading comparisons. |
| Link fuel data to driver behaviour | Idling, harsh braking, and overspeeding KPIs explain why consumption is high; coaching without this link rarely sticks. |
| Meet FORS and DVSA obligations | Record fuel by vehicle registration, appoint a Fuel Champion, and keep commissioning records for every installed device. |
| Fleetalyse for UK rollouts | Fleetalyse provides GPS tracking, driver behaviour monitoring, fuel analytics, and UK-based compliance support for HGV fleets. |
What fleet managers often get wrong about fuel monitoring
The most common mistake isn’t choosing the wrong hardware. It’s treating the telematics rollout as a technology project rather than a change management exercise.
Operators who invest in good devices and solid software, then hand drivers a login and expect behaviour to shift, are consistently disappointed. The data shows the problem clearly enough: idling minutes, harsh acceleration, suboptimal gear selection. What the data can’t do on its own is change the habit. That requires a named person, a consistent feedback loop, and drivers who understand what’s being measured and why. Appointing a Fuel Champion, as FORS recommends, is not bureaucratic box-ticking. It’s the difference between a dataset and a programme.
The second pitfall is skipping the baseline. Fleets that start coaching drivers in week two of a rollout, before they have four to eight weeks of clean pre-intervention data, end up with a savings claim they can’t substantiate. Finance will ask for the before-and-after comparison. If the baseline is contaminated by early coaching activity, the answer becomes a shrug. Patience in the first two months pays back in credibility for the rest of the programme.
The third thing people underestimate is mixed-fleet complexity. A fleet of 40 vehicles that looks uniform on paper often contains three or four vehicles with ECU protocols that don’t play nicely with the chosen telematics device. Finding this out during a 10-vehicle pilot is manageable. Finding it out when you’re halfway through a 40-vehicle installation wave is expensive. The compatibility survey before procurement isn’t optional; it’s the step that determines whether your rollout runs to schedule.
Fleetalyse: your next step for HGV fuel monitoring
Cutting fuel costs across an HGV fleet requires more than a tracker on each vehicle. It requires fuel analytics tied directly to driver behaviour, route data, and maintenance records, all in one place, with support from people who understand UK compliance.
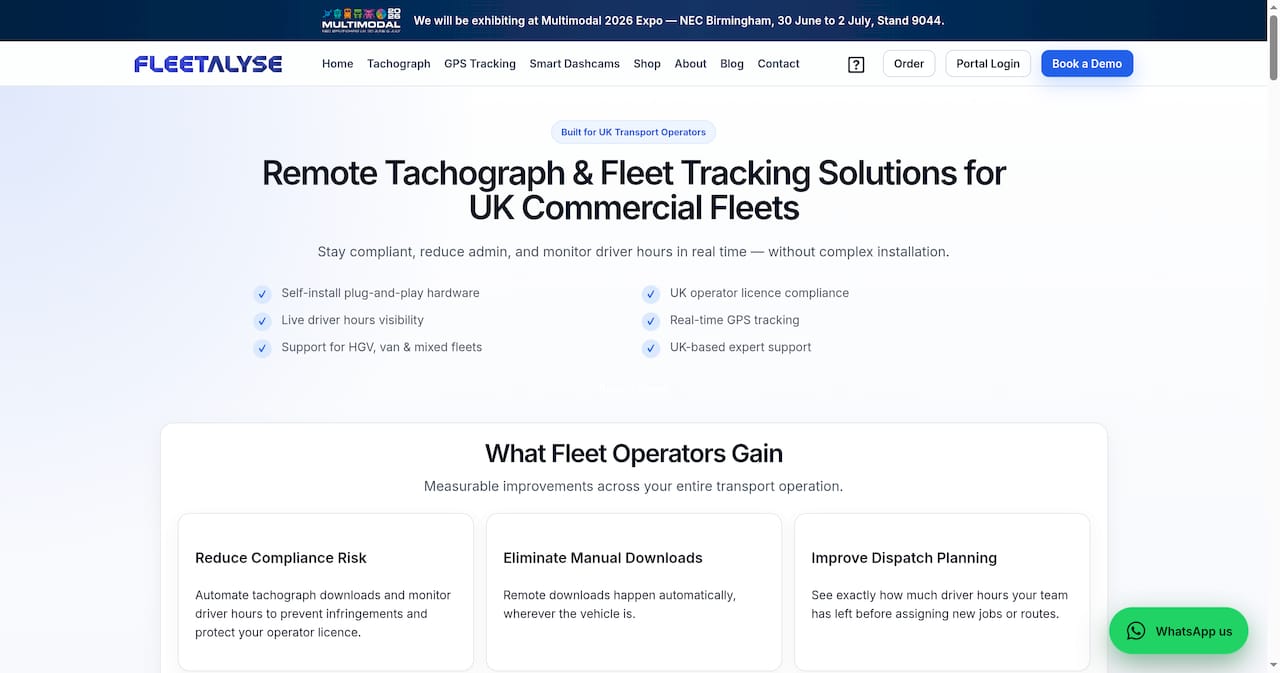
Fleetalyse gives UK fleet operators exactly that: driver behaviour monitoring linked to fuel KPIs, remote tachograph downloads, maintenance scheduling, and real-time alerts, backed by UK-based support that knows FORS and DVSA requirements from the inside. The hardware is plug-and-play, the onboarding is structured, and the pilot process is designed to produce a clear ROI figure within your first quarter. If you’re ready to move from spreadsheets to a system that actually tells you where your fuel is going, explore the Fleetalyse platform and book a discovery call to scope your pilot.
Useful sources and further reading
The following references cover the technical, compliance, and operational dimensions of HGV fuel monitoring in more detail.
- FORS Fuel Management Guide: the primary UK reference for fuel monitoring best practice, FORS accreditation requirements, Fuel Champion governance, and the MPG improvement benchmark. Consult this first for compliance and KPI configuration.
- FleetRabbit: Telematics, Emissions and Performance Checklist: a practical checklist covering baseline MPG configuration, idle-time analysis, PTO tracking, cruise-control utilisation, and weather-normalisation factors. Useful for KPI setup and commissioning.
- Fueltek: Fuel Management Systems and Software: reference for depot-level dispensing systems, pump-side transaction capture, and fuel-card reconciliation. Relevant for operators running their own refuelling facilities.
- Volvo Trucks: Fuel and Energy Efficiency: covers vehicle-level features such as map-based speed and gear guidance, and their interaction with fleet telematics. Useful context for route optimisation and operational lever discussions.